OW70L-Dac - OneWeb LEO User Terminal
44
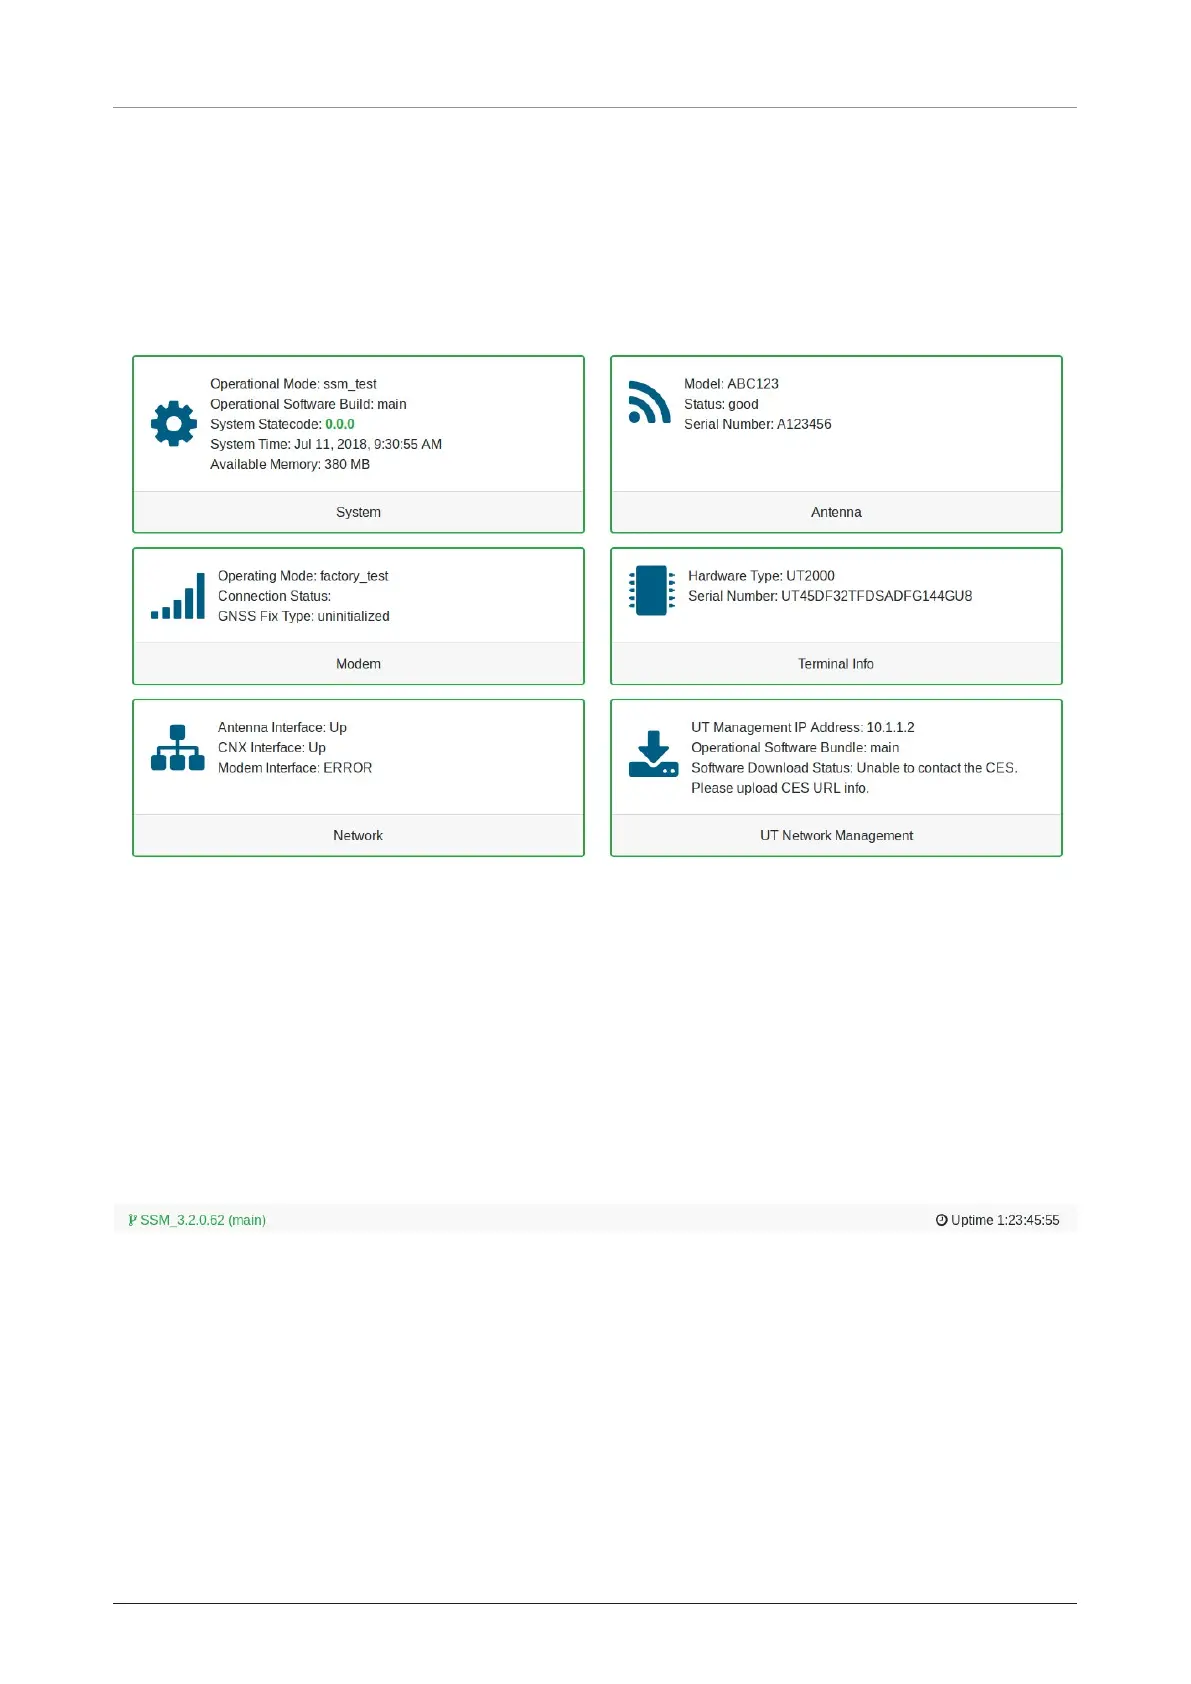
8.5.2 Home Page
The home page consists of several cards that display a high-level overview of certain components such
as the UT System, Antenna, or UT Network Management. Each card has a border that, depending on the
status of the subsystem, changes colour. If the subsystem is in a bad state, the card is outlined in red. If the
subsystem is behaving as normal, then the card is outlined in green. Clicking on a card will take you to the
webpage where you can find more detailed information about the subsystem.
8.5.3 Footer
The footer, like the navigation bar, is persistent throughout all LUI pages. The footer contains two pieces of
information: one on the left and one on the right.
The current software version that is running on the Host Processor is displayed on the left. The operational
software mode follows the software version. If the operational software mode is a factory, the text colour is
red. If the operational software mode is main, the text colour is green. Clicking on this will take you to the
UT Status section of the Diagnostics page.
The system uptime is displayed on the right. It displays how much time has passed since the last reboot.
The format is days:hours:minutes:seconds.

 Loading...