LBL-01791 [B] Laborie alpHaONE User & Service Manual 41
4 The Analysis Module
Introduction
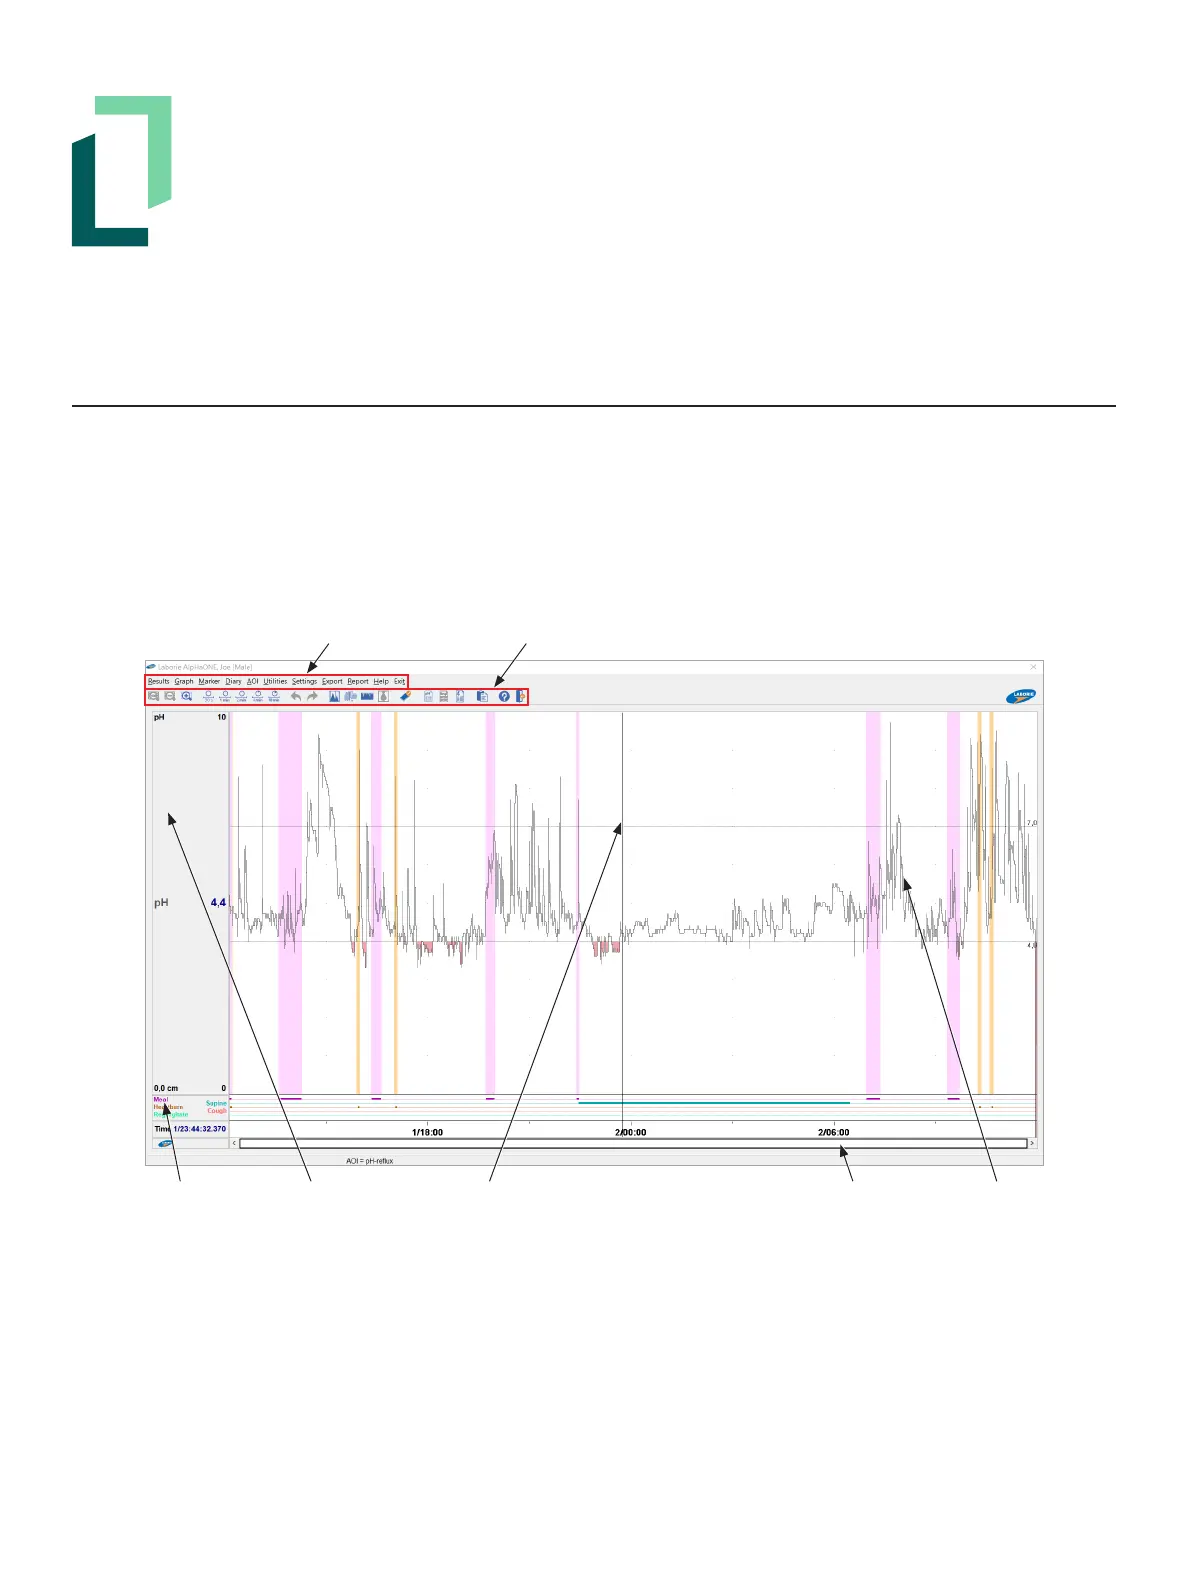
ThischapterpresentsadescriptionofthemenuitemsandsettingsintheAnalysismodule,asshowninFigure4-1.
You can perform analysis immediately after transferring investigation data to the computer (see the section “Stop
RecordingandTransferData” on page 32). You can also select a study from the investigation list. To start the
Analysismodule,intheDatabasemoduledouble-clicktheInvestigation name or the investigation preview.
Menu Bar Button Toolbar
Diary Channels Cursor Line GraphScrollbar
Figure4-1: TheAnalysisModule
In the middle of the screen is a vertical cursor line that you can move about the graphs by simply moving your mouse.
Asyoumovethecursorlinealongthegraph,inthecolumnontheleft,youwillseechannelinformationandvalues
thatreectthespeciclocationofthecursorline.
Youalsocanusethemouseinthegraphareatozoomintoshowdetailsbyclickinganddraggingarectangleover
the area on which you want to focus. When the investigation is zoomed in, the scrollbar at the bottom of the graph
indicates the part of the pH study that is shown on the screen. To see other parts of the investigation, drag the
scrollbar left or right.