Chapter 4 TheAnalysisModule 49
Displaying a Specic Study Day
UsingtheDayselectorbuttonsonthetoolbar,youcanchooseaspecicdaywithinthestudytodisplayonthegraph
(depending on the length of the study) or you can choose to view all days. The button highlighted in blue indicates the
current selection.
Displaying Contour Plots
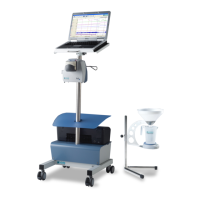
The contour plots, shown in Figure4-10,presentagraphicrepresentationofthemovementoftheuidsinthe
esophagus and the pH value through color tones to help you better visualize both. To display the contour plots of the
pHvalues,onthetoolbar,clicktheContourplot(C) button and then choose Graph > Toggle contour plot or, on the
keybpard,pressC.
Figure4-10: Displaying a Contour Plot
pH plot
For the pH channel, a contour plot is displayed (default red). To visualize the value of the pH, the plot has a wave form.
ThelowerthepHvalue,thehighertheamplitudeofthecontourplot.Also,thepixelshaveatonebetweenbackground
color and pH color. For more information, see the section “SystemSettings” on page 57.
Copy to Clipboard and Save As
You can copy the graph displayed on the screen to the clipboard and paste it in another program such as Microsoft
PaintorPowerPoint.Youalsocansavethegraphonthecomputer’sharddriveortoaUSBmemorystickasaBMPor
JPEGle.
Marker
Introduction
Markersarerequiredtoanalyzetheresults.Youcaninsertmarkers,delete(all)markers,movemarkers,andchange
thecategoryofamarker.Theinsertionofmarkersaffectstheresultsoftheanalysis.