ECO GOLD
25/08/2011/ YACE0088 Appendix with settings 89
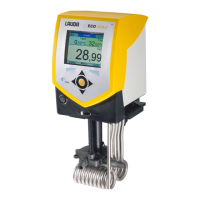
C Graphical display of temperature measurements
− From the main menu window you access the graphics win-
dow by pressing
(display).
The temperature traces are shown in different colors.
T
set
set-point temperature (red)
T
int
internal bath temperature (green).
T
ext
external bath temperature (blue).
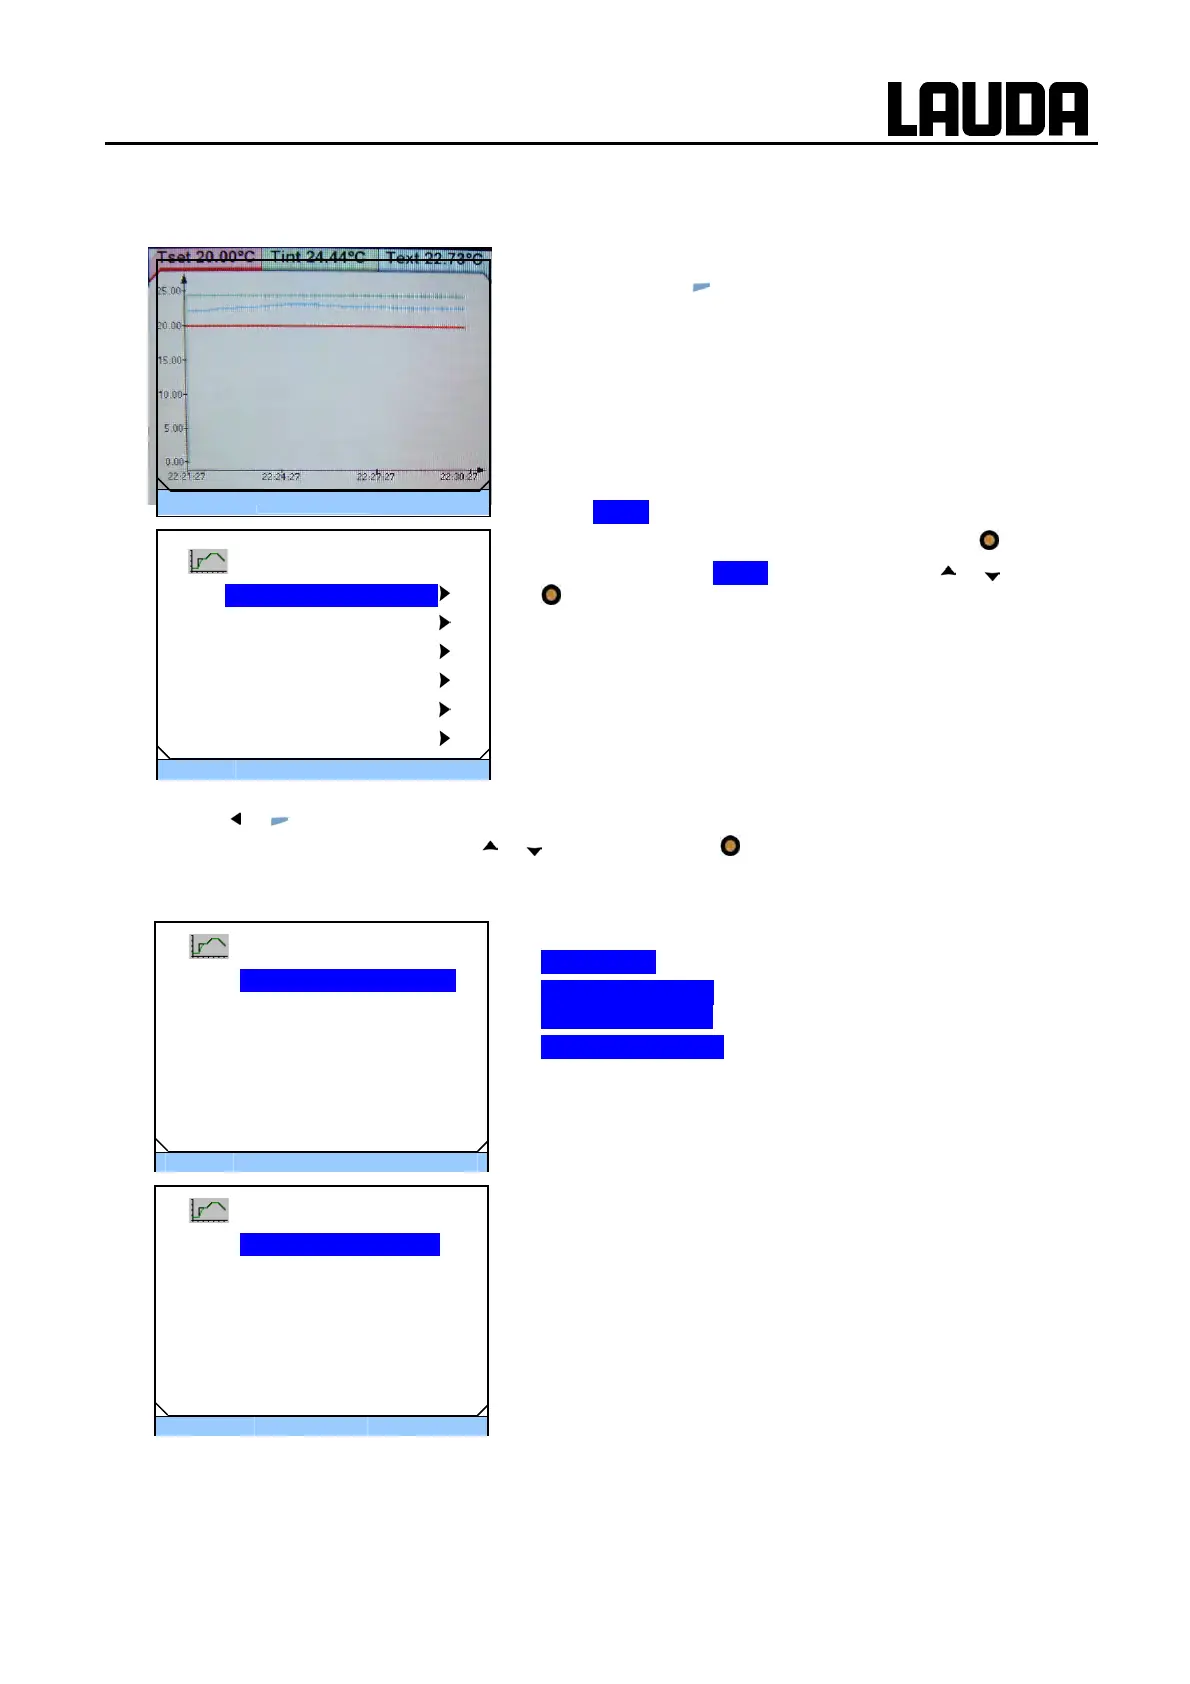
You can change the settings for the graphics window in the
submenu Graph.
− Access to the menu level is obtained by pressing
.
− Select and confirm Graph in main menu with or and
.
The adjacent menu window appears.
− With
or you quit the respective window without changes.
− All menu points are selected with
or and confirmed with .
In the following the individual menu points of the menu window "Graph" are described.
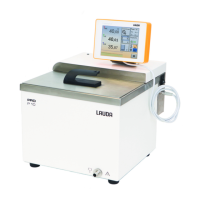
In the menu "Mode" there are the following settings:
− Online graph Recording runs continuously.
− Recording Start Start or stop recording
Recording Stop
− Freeze Graph Start Save current recording.
With display measurements you can define which temperature
values are to be graphically displayed.
Numerous combinations are offered in the menu (see illustra-
tion).
Display
סּ Menu
Standby
ESC
סּ OK
Standby
Mode
Online graph .
Record Start
Freeze Graph Start
ESC
סּ OK
Standby
Displayed value
Tset Tint Text 3
Tset Tint
Tset Text
Tint Text
Tint
Text
ESC
סּ OK
Standby
Graph
Mode
Displayed value
Sample Time
Time axis
Time base
Temperature scale