Gocator Line Profile Sensors: User Manual
Gocator Web Interface • 155
2. Select the View options in the data viewer.
Profile, Heightmap, Grayscale, Uniform, or Intensity can be selected from the left drop-down list.
The view from an individual sensor or the combined view of two sensors can be selected from the right
drop-down list.
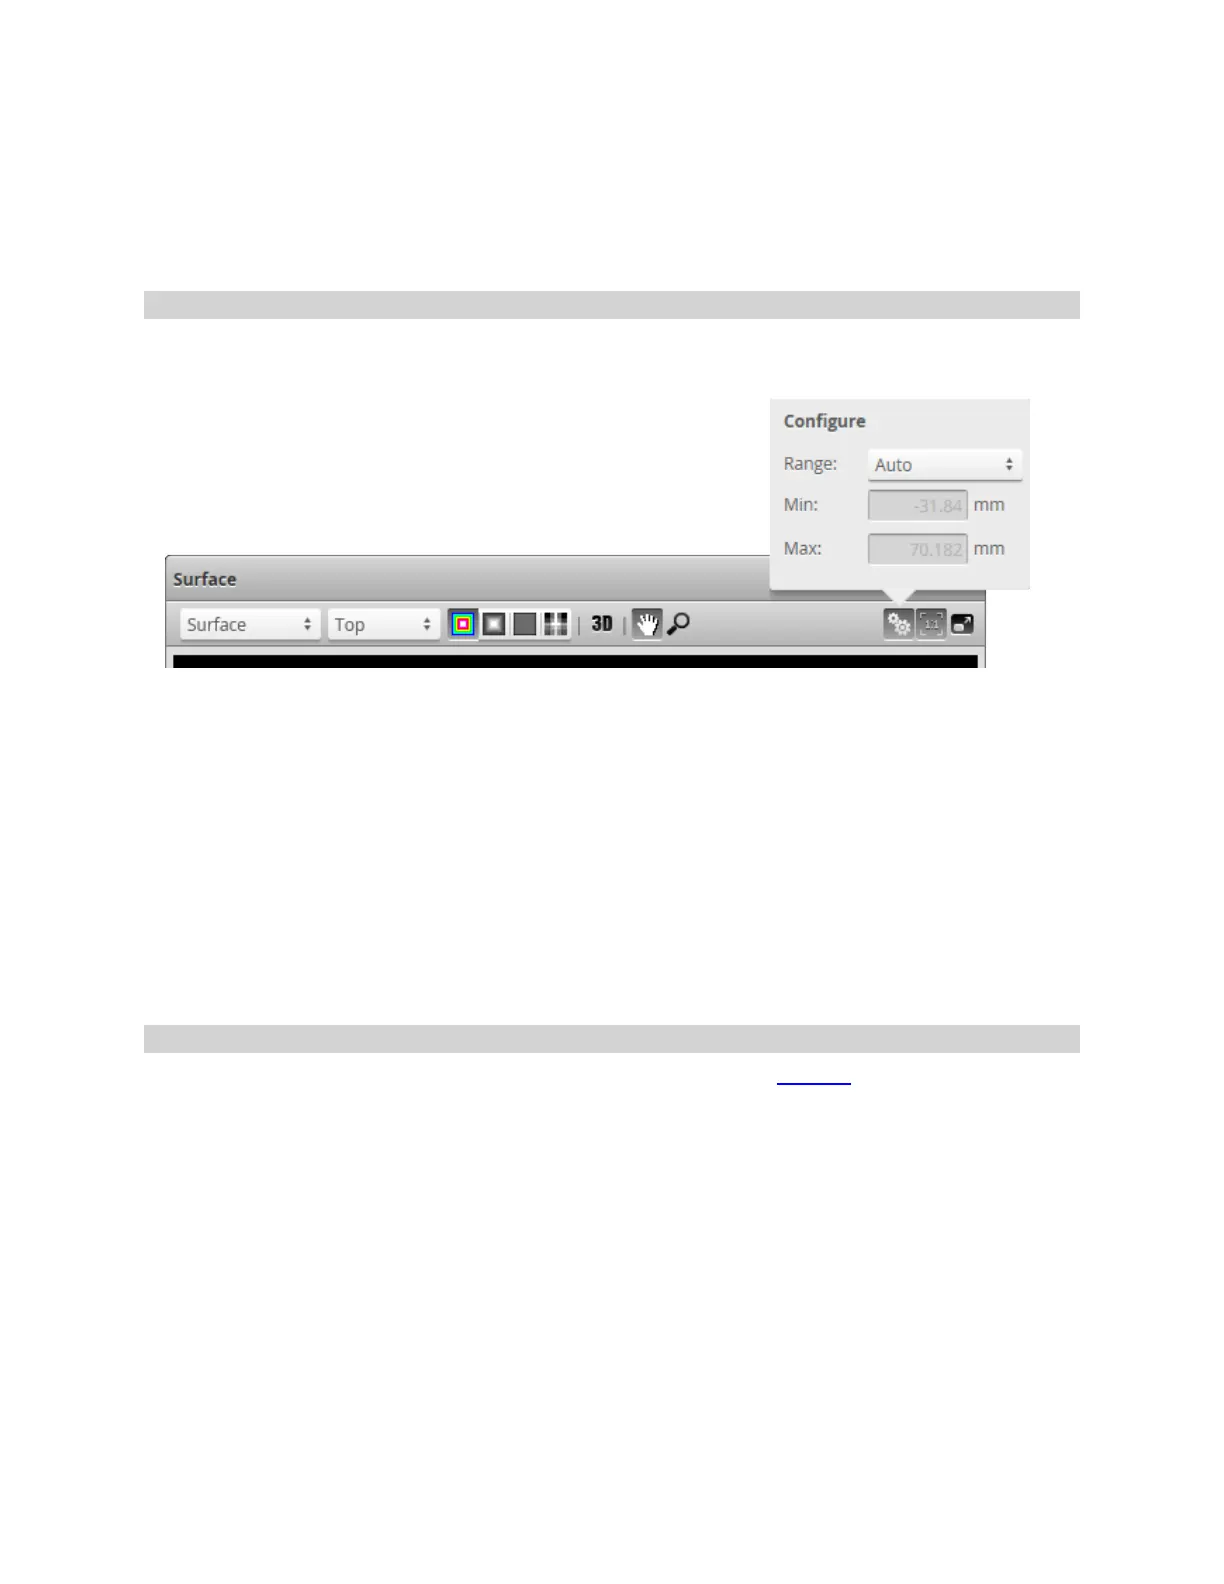
Height Map Color Scale
Height maps are displayed in pseudo-color. The height axis (Z) is color-coded. The scaling of the height
map can be adjusted.
To change the scaling of the height map:
1. Select Heightmap from the View drop-down in the data viewer.
2. Click the Scaling button.
l To automatically set the scale, choose Auto in the Range drop-down.
l To automatically set the scale based on a user-selected sub-region of the heightmap, choose Auto
- Region in the Range drop-down and adjust the yellow region box in the data viewer to the desired
location and size.
l To manually set the scale, choose the Manual in the Range drop-down and enter the minimum
and maximum height to which the colors will be mapped.
Sections
When the Gocator is in Surface scan mode, the data viewer can display sections (profiles extracted from
surfaces).
 Loading...