Gocator Line Profile Sensors: User Manual
• 550
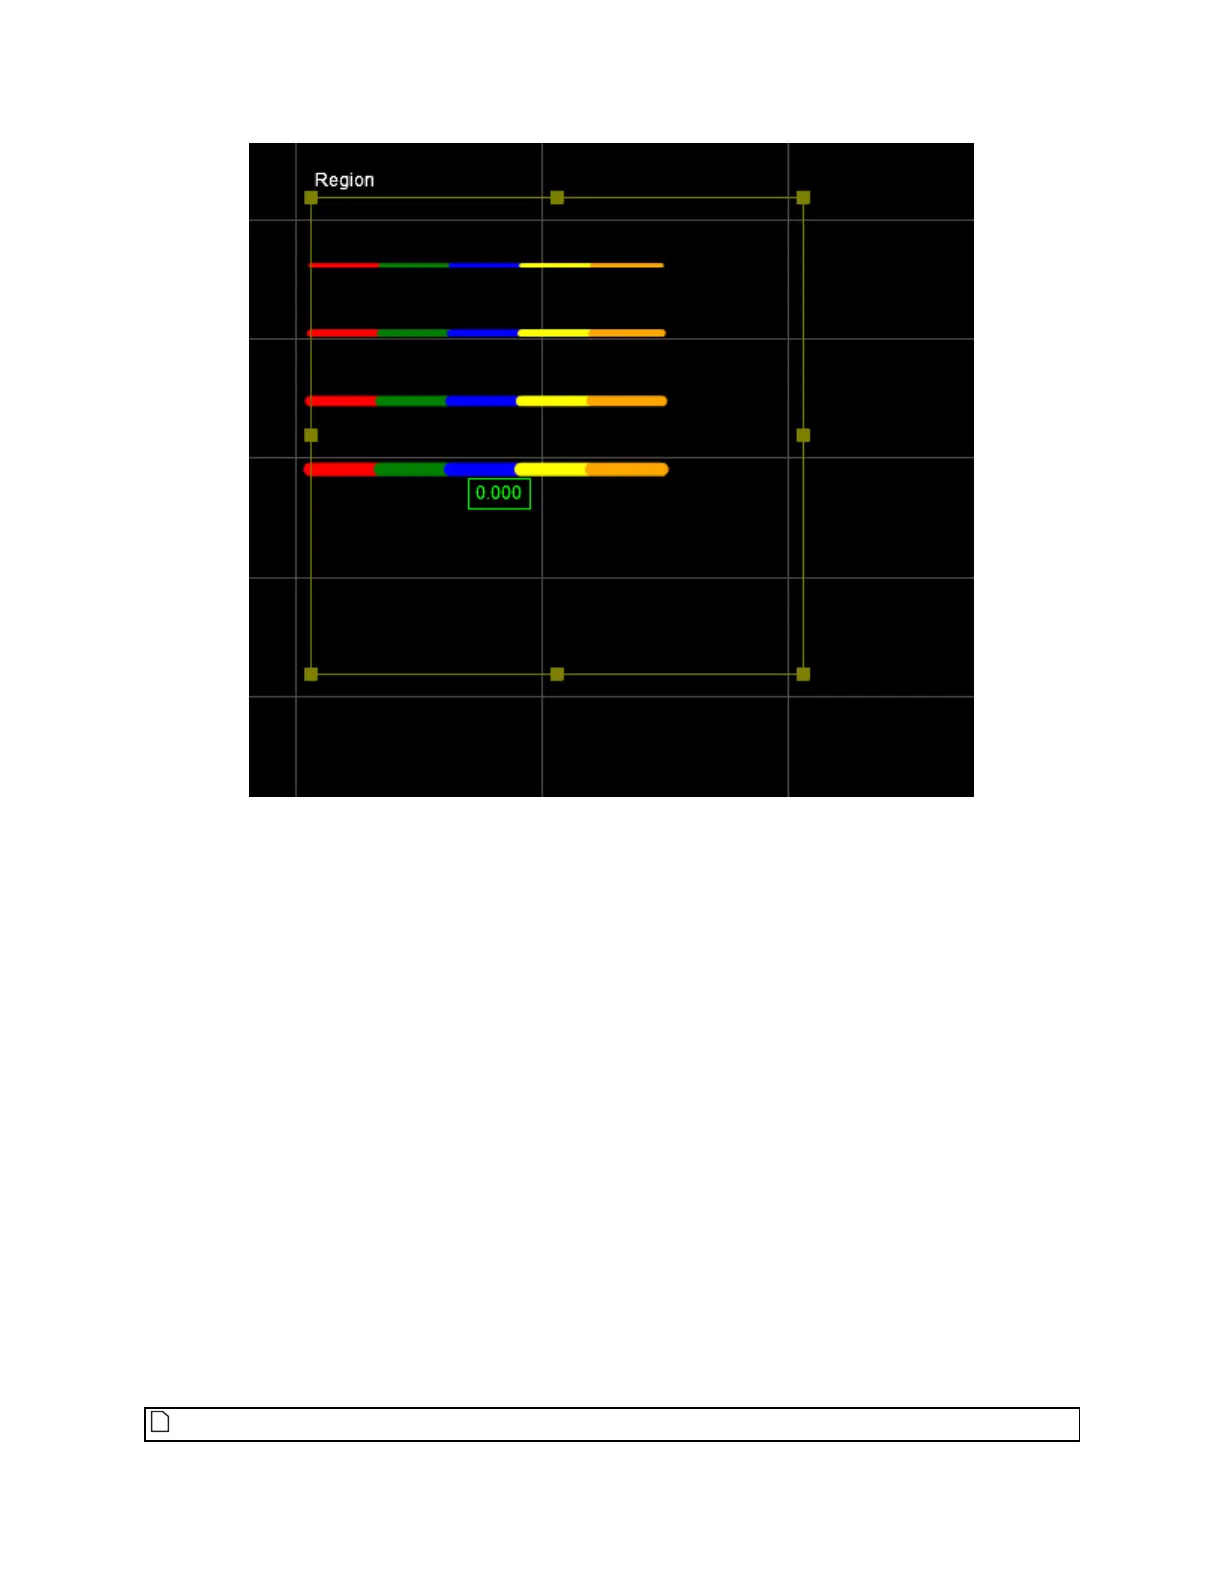
Line graphics
To create graphics:
1. Use GdkGraphic_Construct to create a graphic object.
2. Use GdkGraphicPointSet_Construct to create points or GdkGraphicLineSet_Construct to create
lines.
3. Add the points and lines to the graphic object using GdkGraphic_AddPointSet and GdkGraphic_
AddLineSet.
4. Output using GdkToolOutput_SetRendering.
The following illustrates the process:
kTest(GdkGraphic_Construct(&graphic, kObject_Alloc(tool)));
kTest(GdkGraphicPointSet_Construct(&pointSet, 4.0, kMARKER_SHAPE_CROSS, kCOLOR_LIME,
&point32f, 1, kObject_Alloc(tool)));
kTest(GdkGraphic_AddPointSet(graphic, pointSet));
kTest(GdkToolOutput_SetRendering(output, measurementIndex, graphic));
The GDK example TestSurfaceGraphics shows how to use the graphics functions.
Graphic functions take an array of kPoint3d32f. It does NOT accept kPoint3d64f.
 Loading...
