48
48
The GS550 System
The GS550 System
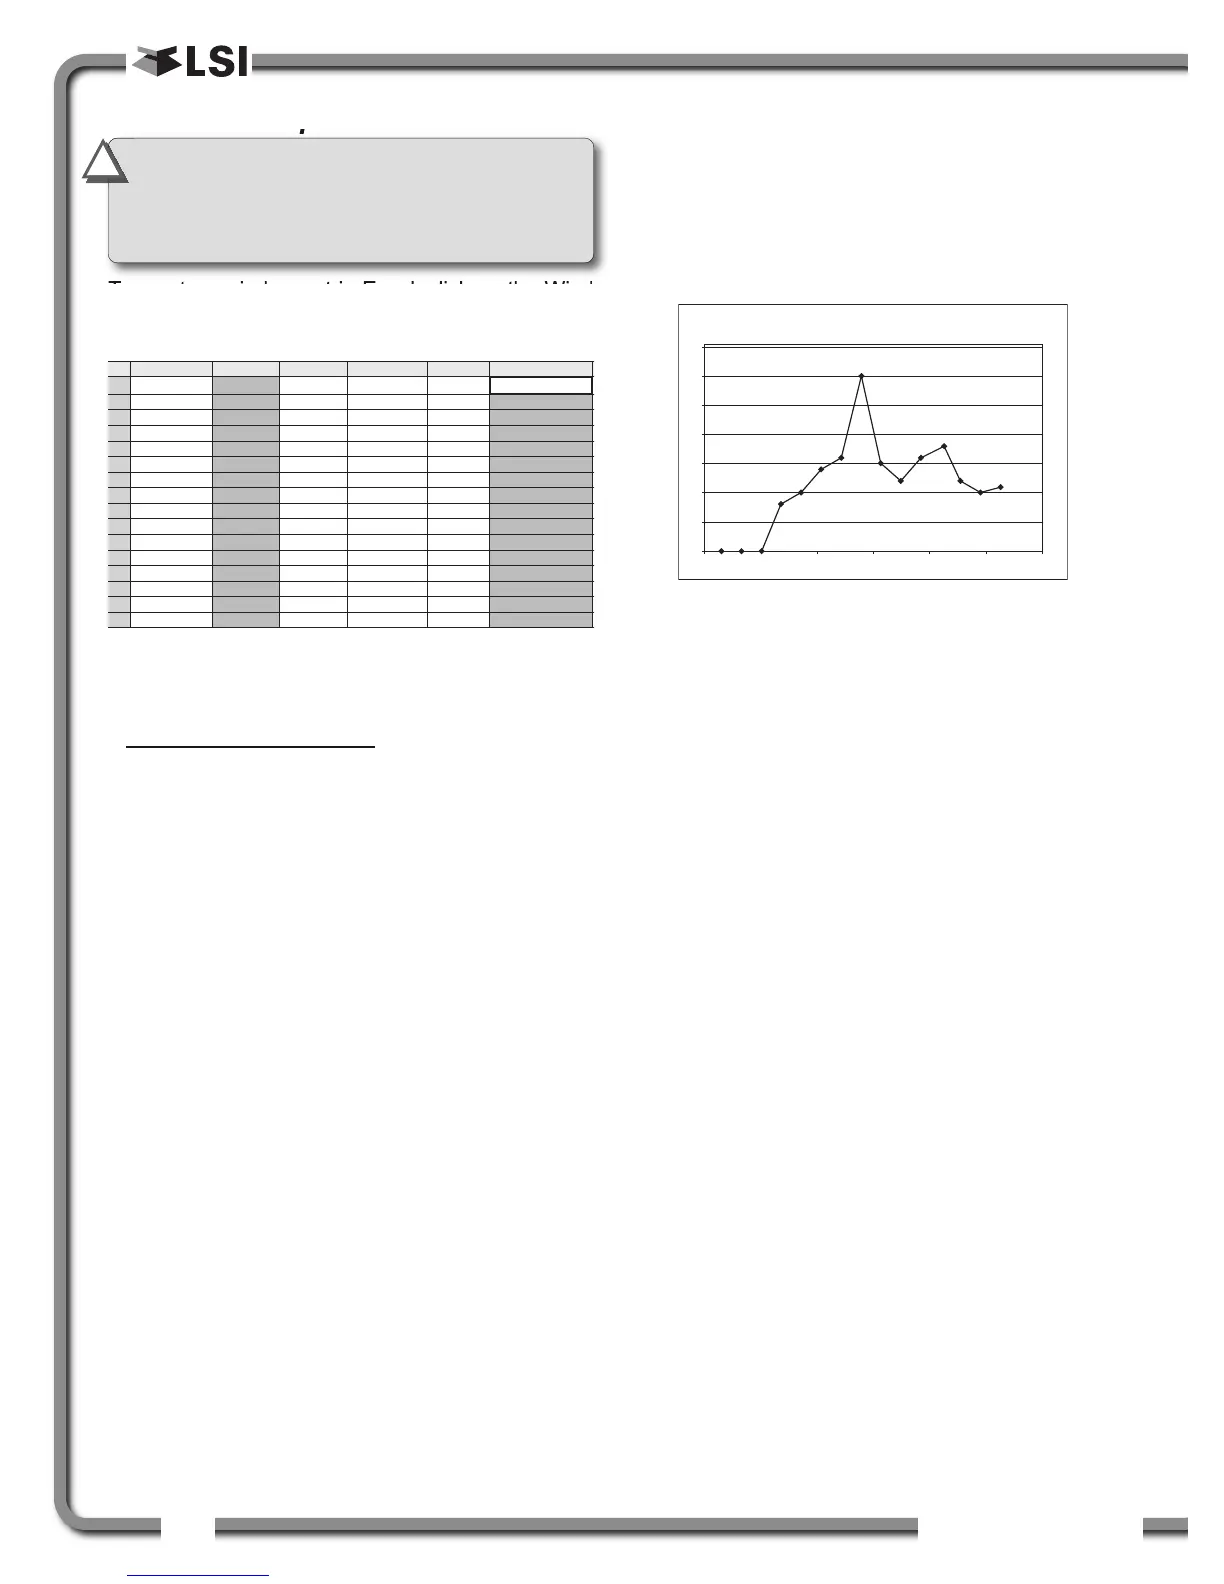
4.3d Wind Report
To create a w i n d r eport in Exc e l , c l ick on the Wind
Report button in the tool bar.
Table: Wind report column headings
Column Description
Date ....................Date of event recorded
Time....................Time of event recorded
Sensor ID ..........Wind speed sensor ID number
Wind (mph) ........Average wind speed during the period
Nb. Gust ............Number of gusts exceeding the wind
speed maximum limit during the period.
Max. Gust (mph) Maximum wind speed (gust) during the
period.
Wind charts. The data from the Wind or Max Gust
columns can be easily charted.
1. Press Control and select the time column and
either the Wind or the Max Gust column.
2. Click Insert → Chart
3. Select X-Y (Scatter)
A
Date
2006-12-28
2006-12-28
2006-12-28
2006-12-28
2006-12-28
2006-12-28
2006-12-28
2006-12-28
2006-12-28
2006-12-28
2006-12-28
2006-12-28
2006-12-28
2006-12-28
2006-12-28
B
Time
17:17:41
17:18:42
17:19:43
17:20:44
17:21:45
17:22:46
17:23:47
17:24:49
17:25:50
17:26:51
17:27:52
17:29:03
17:29:54
17:30:55
17:31:56
C
Sensor ID
10033
10033
10033
10033
10033
10033
10033
10033
10033
10033
10033
10033
10033
10033
10033
D
Wind (mph)
0
0
0
5
6
8
12
22
13
9
9
8
8
7
7
E
Nb.Gust
0
0
0
0
0
0
0
1
0
0
0
0
0
0
0
1
2
3
4
5
6
7
8
9
10
11
12
13
14
15
16
F
Max.Gust (mph)
0
0
0
8
10
14
16
30
15
12
16
18
12
10
11
Figure: Excerpt of a Wind Report
0
5
10
15
20
25
30
35
17:16:48 17:19:41 17:22:34 17:25:26 17:28:19 17:31:12 17:34:05
Max .Gus t ( mph )
Figure: Max. Gust Chart
IMPORTANT!
The wind report is only
available when the data has been recorded
with the data logger in the automatic
recording mode.
!
!
 Loading...