Reviewing Sample Results
7-29
For every parameter, the lower dash line of its trend represents the lower limit of the
expected range, 10% below the mean, of the analysis result. In case of WBC in Figure
7-45 , the lower limit is “8.4”.
For every parameter, its mean is displayed between the values of the upper dash line
and of the lower dash line. In case of WBC in Figure 7-45, the mean is “9.3”.
For every parameter, the three numbers on the right of its trend represents:
“Mean” – the mean value of the saved results
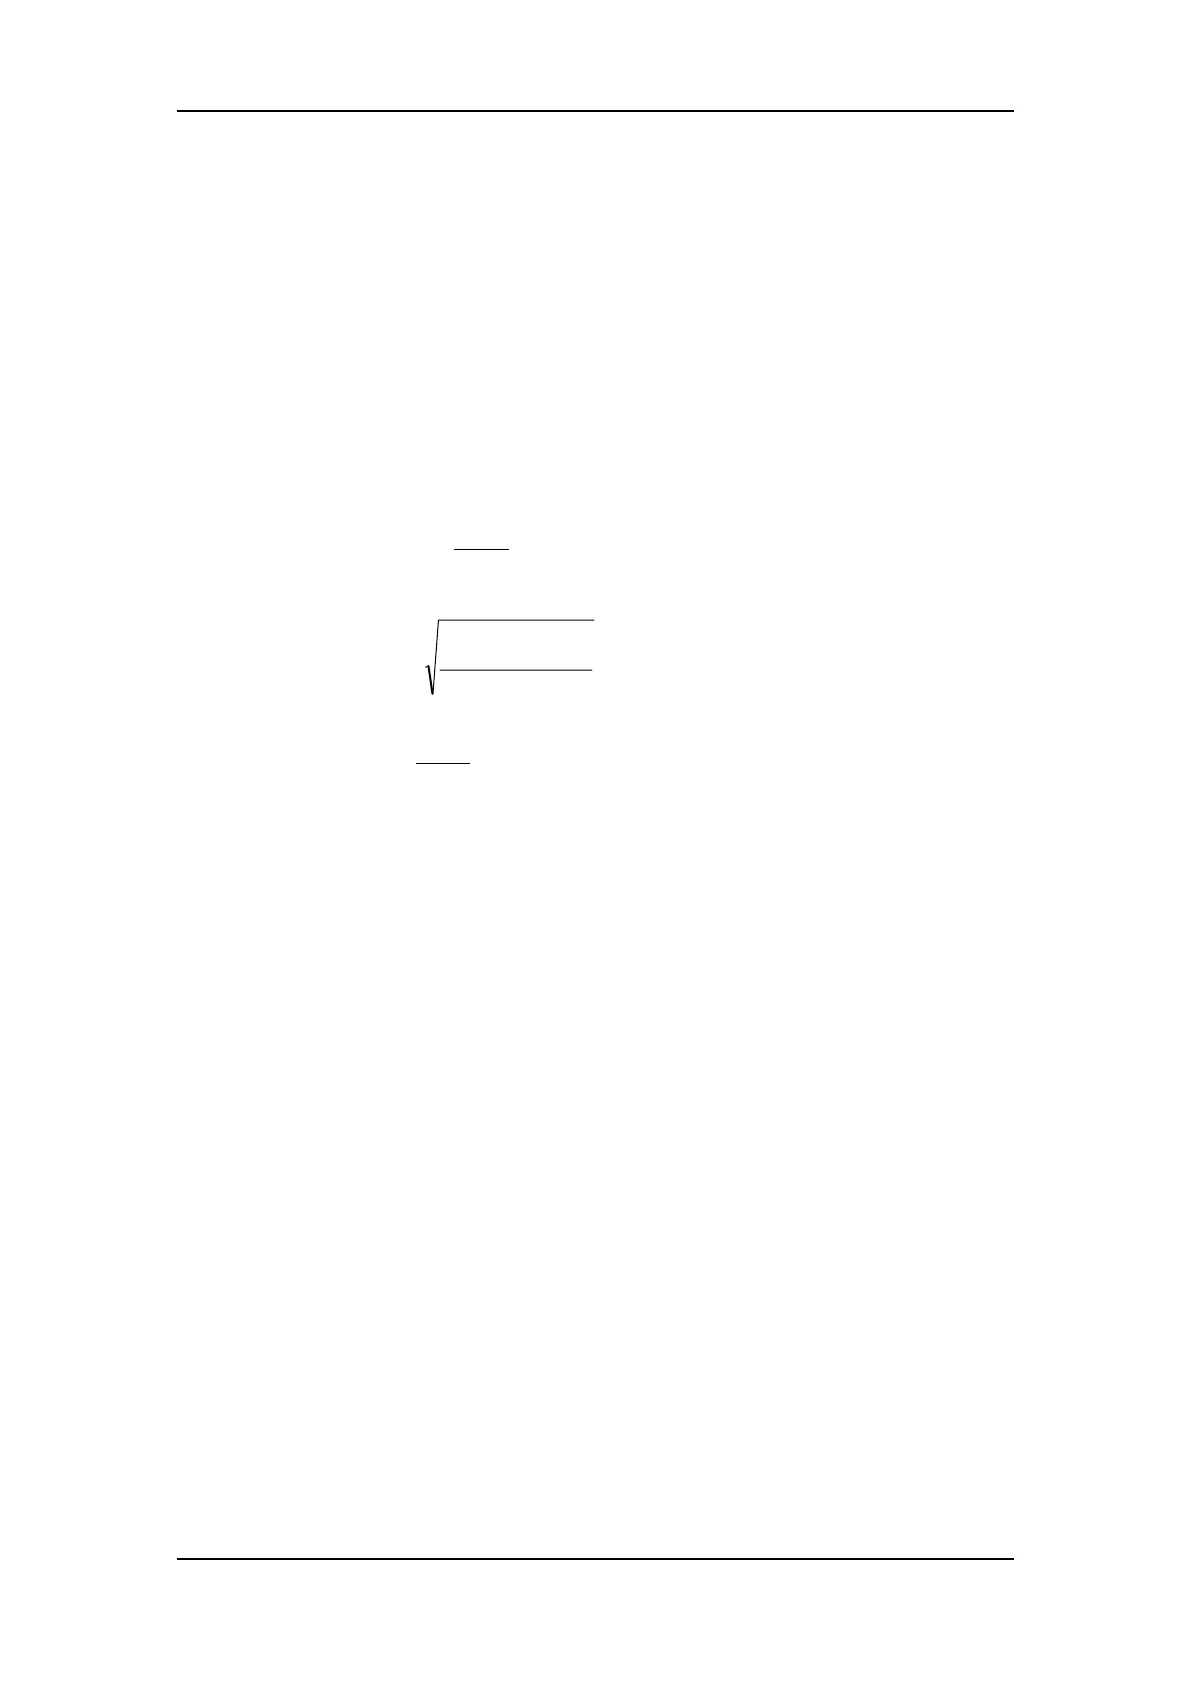
“Diff” – standard deviation of the saved analysis results
“CV” - Coefficient of Variation
where n represents how many sample results are selected and X
i
is the result of the i
th
analysis. If the selected samples are less than 3, the three indices will all be 0. If the analysis
result of certain parameter is invalid (***), the three indices will also be invalid (***). Under
these two circumstances, the three values on the left of the trends are the parameter’s means
and expected ranges set by the user (see Chapter 5.3.6).
Every point in the graph is interpreted as follows:
The darkened square ■ that falls between the upper dash line and the lower dash line is
within the expected range. Otherwise, it is not. The blank square □ represents the sample
analysis either ran into errors or the result is out of the display range.
7.3.3 Reviewing Search Result in the “Histogram” Mode
Entering the “Histogram” mode
At the “Review” screen, press [↑] to select the “Searched” database and then press [↓] to
enter the “Histogram” screen, as Figure 7-47 shows.
n
X
Mean
n
1i
i
∑
=
=
()
1n
Mean
i
X
2
Diff
−
∑
−
=
%100
Mean
Diff
CV ×=

 Loading...