SUPREMATouch
28
Operation of the System
MSA
US
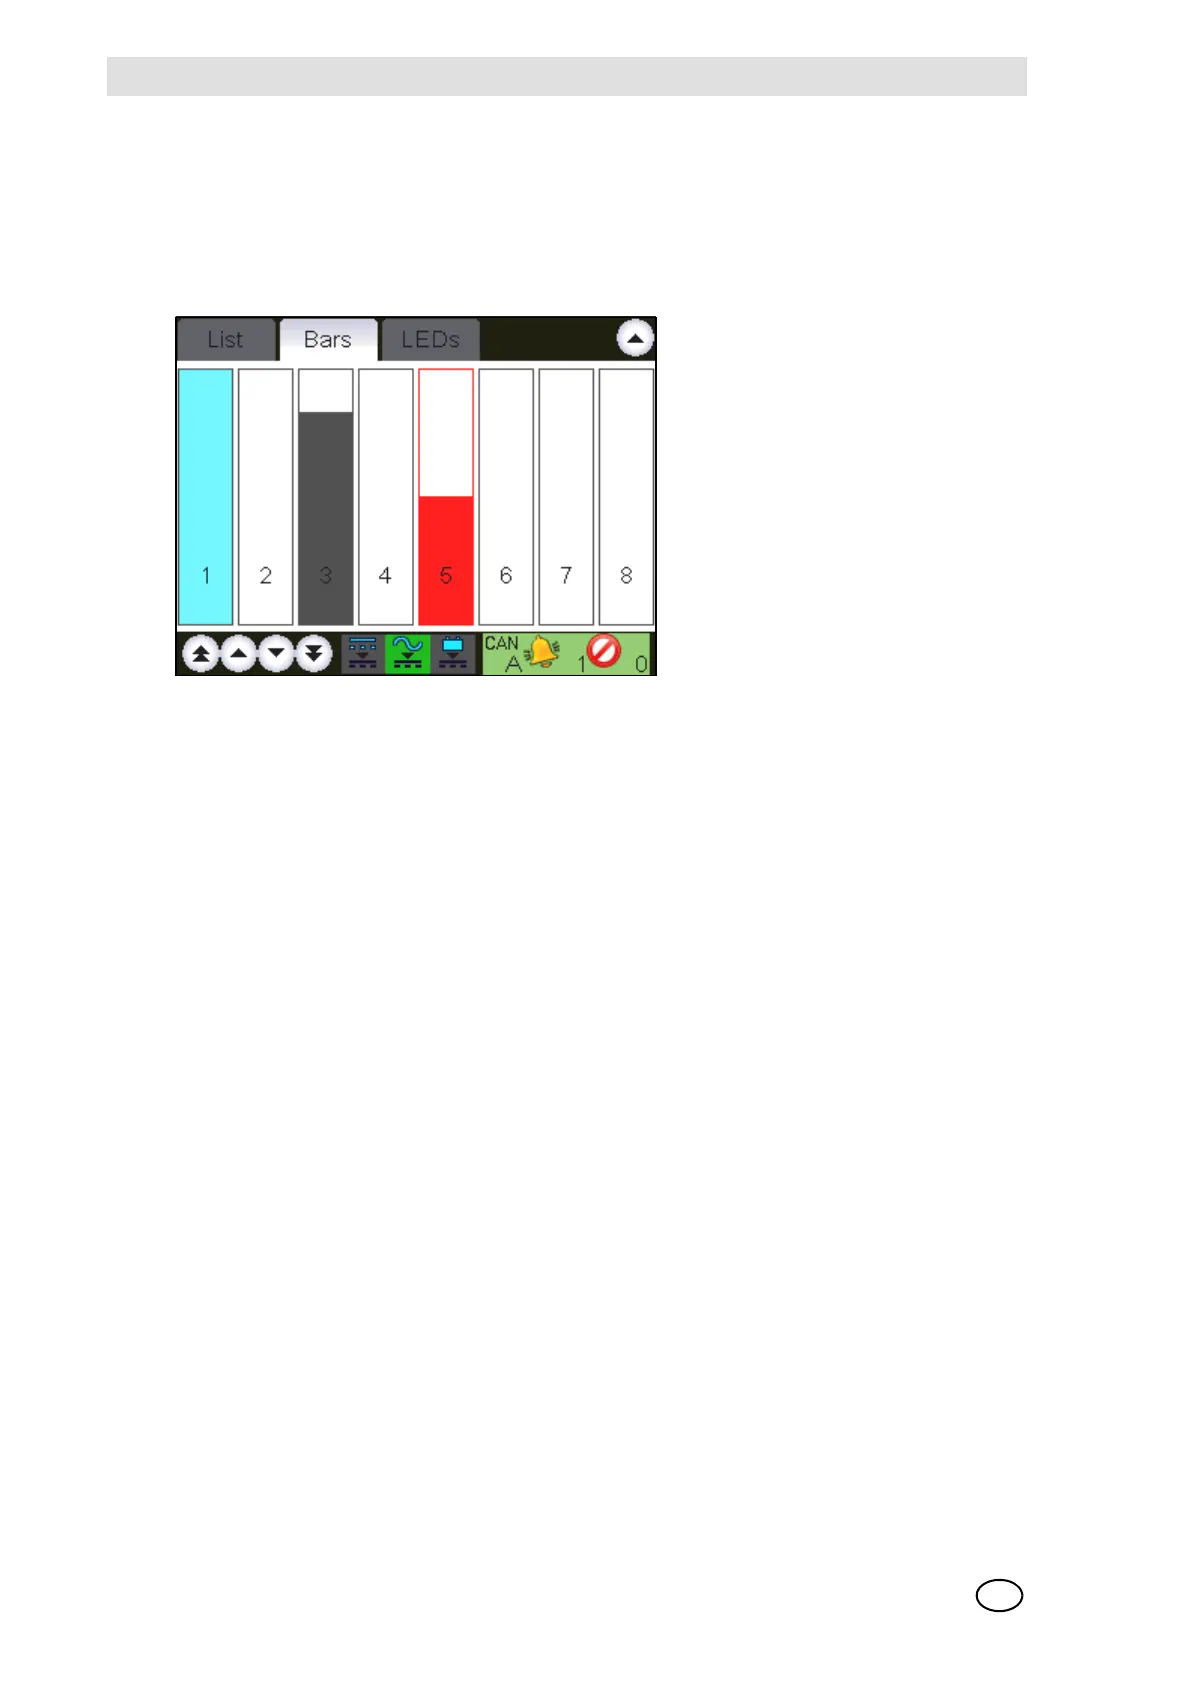
Bar Display
This display shows the measured values as vertical bars, where each bar represents the relative
measurement value of an input with respect to full scale. The value range that can be displayed
is 0 ... 100% of full scale.
The corresponding input number is shown under each bar.
Fig. 11 Bar display
Measured values are normally displayed as solid bars. In error-free operation with no alarms, the
bars are grey. Any alarm will cause the corresponding bar to change to red. When a status mes-
sage occurs for an input, the bar is shown only as an outline with a status identification letter.
Legend:
If an input is not configured no bar is displayed in that column.
LED Display
This window shows the status values of the inputs as LEDs. Each LED column has the corre-
sponding input number below it. In redundant systems, the information is shown separately for
each CAN bus.
- LED off [grey]: not inhibited, no alarm, no failure
- LED on: inhibited, alarm, failure
If an input is not configured no LEDs are displayed in that column.
I Inhibit
Ccalibrating
F Fault [measuring value below range, measuring value missing]
O measurement range exceeded [overflow]
S Alarm suppressed [during the warm-up period of special sensor types]