RP0176-2003
NACE International 37
0
50
100
150
200
250
300
350
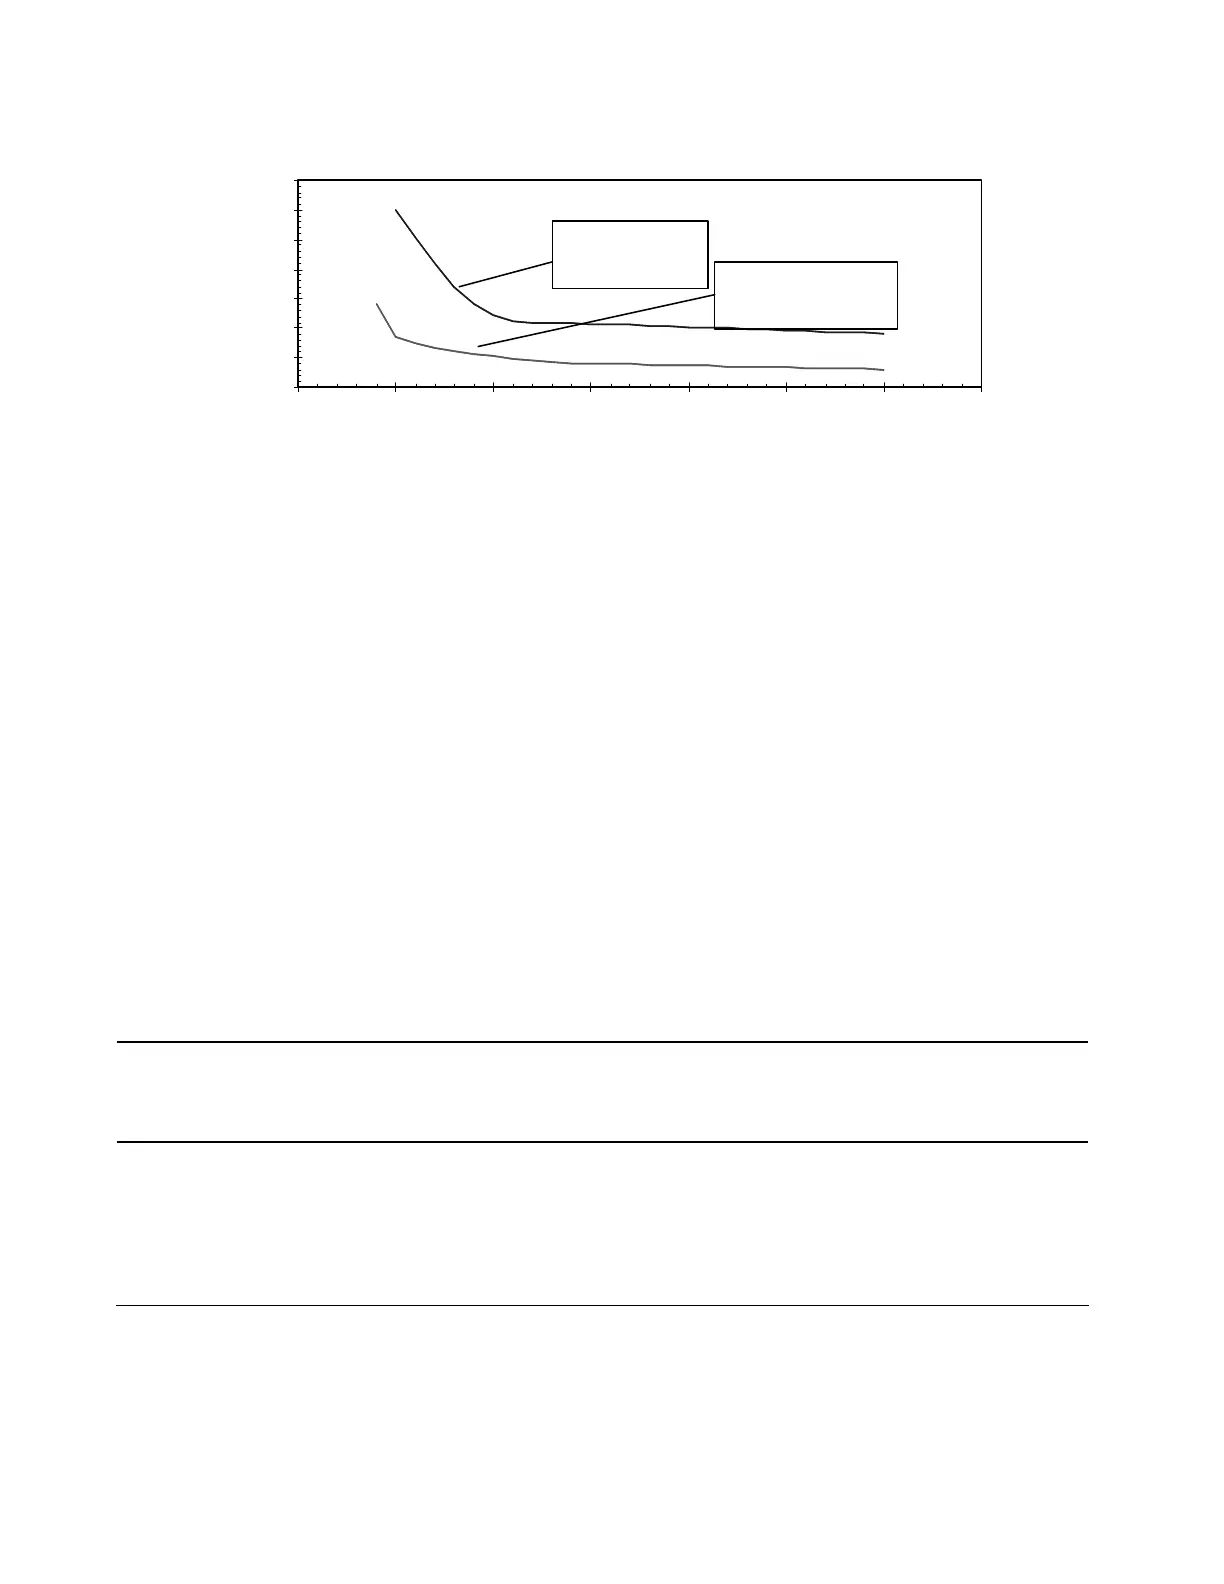
0 5 10 15 20 25 30 35
TEMPERATURE, Celsius
CURRENT DENSITY, mA/m
2
Dens it y
Maintenance Current
Den s it y
Figure A1: Current Density/Temperature Curves
________________________________________________________________________
Appendix B: Energy Capabilities and Consumption Rates of Various Commercial Galvanic
Anodes Available for Cathodic Protection of Offshore Structures
The energy capability of a given galvanic anode material is
usually expressed in terms of ampere-hours per kg (lb) of
material. This figure, when divided into the number of hours
per year (8,760), gives the anode consumption rate in kg
(lb) per ampere-year, a more useful form of energy rating to
the design engineer.
The energy capability of any galvanic anode material selec-
ted for use in offshore CP design should be previously esta-
blished through controlled laboratory and field tests at an
anode current density normally expected in field applica-
tions, i.e., approximately 2.2 to 7.5 A/m
2
(200 to 700 mA/ft
2
)
of anode surface. Table B1 lists the established energy
capabilities of some of the more commonly used galvanic
anode materials at anode loadings of 2.2 to 7.5 A/m
2
(200
to 700 mA/ft
2
). The differences shown for any one material
are attributed to variations in composition and/or heat treat-
ment offered by the various manufacturers. Table B1 also
lists the corresponding anode consumption rates, calcu-
lated as stated above. Therefore, it is prudent in design of
galvanic CP systems to consider that anode capacity may
be less than is predicted from short-term testing.
Segregation of some minor alloys and/or impurities during
cooling can alter the galvanic properties of the anode mat-
erial. Any potential segregation is more pronounced on the
interior portions of larger anodes because of slower cooling
after casting.
Any anode material must be capable of a sufficient driving
voltage to provide the necessary design current output. A
check for proper driving voltage of an anode can be made
by measuring the closed-circuit potential of the anode,
using a suitable reference cell.
Table B1: Energy Capabilities and Consumption Rates of Galvanic Anode Materials in Seawater
Galvanic Anode
Material
Energy Capability
(A)
A-h/kg (A-h/lb)
Consumption Rate
Kg/A-yr (lb/A-yr)
Anode to Water
(B)
Closed Circuit
Potentials, Negative
Volts (Ag/AgCl[sw])
Aluminum-zinc-indium 2,290 to 2,600 (1,040 to 1,180) 3.8 to 3.4 (8.4 to 7.4) 1.05 to 1.10
Aluminum-zinc-mercury 2,760 to 2,840 (1,250 to 1,290) 3.2 to 3.1 (7.0 to 6.8) 1.0 to 1.05
Aluminum-zinc-tin 930 to 2,600 (420 to 1,180) 9.5 to 3.4 (20.8 to 7.4) 1.0 to 1.05
Zinc (MIL-A-18001)
8
770 to 820 (350 to 370) 11.2 to 10.7 (25.0 to 23.7) 1.0 to 1.05
Magnesium (H-1 alloy) 1,100 (500) 8.0 (17.5) 1.4 to 1.6
___________________________
(A)
The above data show ranges that are taken from field tests at Key West, Florida, by Naval Research Laboratory, Washington, DC,
38
and
from manufacturers’ long-term field tests. Modification to these numbers will be made only by recommendation from NACE International STG
30 on Oil and Gas Production—Cathodic Protection.
(B)
Measured potentials can vary because of temperature and salinity differences.
Temperature (°C)
Current Density (mA/m
)
Polarization
Current Density
Maintenance
Current Density