11.1 About I⁄Q Analyzer mode
Narda IDA-3106 201
There are five different views available.
To select a view:
Press the View softkey and select a view.
NOTE: Magnitude corresponds to the results of Time Domain (Scope) mode / High
Resolution Scope sub mode (see About Time Domain (Scope) mode on page 182 for
information).
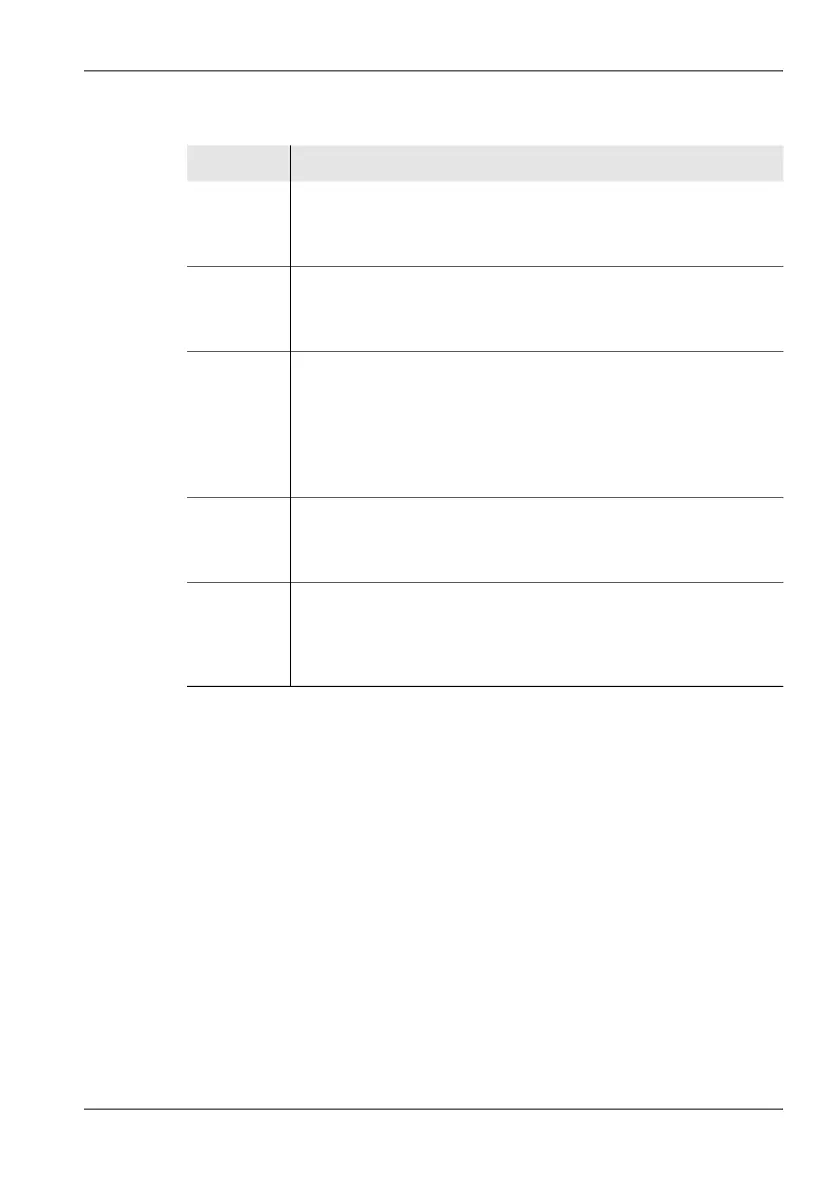
View Description
I/Q Displays the time characteristic of the captured raw data as I (in
phase demodulated signal) and Q (quadrature demodulated signal)
components. Experts can draw conclusions about modulation types
and interference just from the shape of the signal.
Magnitude Displays the time characteristic of the signal power level. The
magnitude is used as a trigger source for the I⁄Q Analyzer. A video
bandwidth VBW can be set for smoothing the signal, which may be
necessary for triggering. The VBW does not affect other Views.
HiRes
Spectrogram
Full
The measured signal is displayed as a gapless, time-compressed
spectrogram so that the entire characteristic can be seen on the
screen. The spectrums can be selected and viewed with their full
time resolution using the marker.
(For information about spectrograms, see Displaying the time
characteristic (Spectrogram) on page 168 and The Spectrogram
Marker on page 171.)
HiRes
Spectrogram
Zoom
Comparable to the "HiRes Spectrogram Full" view but without any
time compression. Each spectrum captured is shown as a separate
spectrogram line. You can scroll through the spectrogram in Hold
mode.
Persistence
Spectrum
All the computed spectrums are displayed as level versus frequency.
The color indicates the number of times that the level occurred. This
corresponds to a "digital afterglow effect", which makes it possible to
recognize signals with superimposed frequencies or which occur
sporadically.