2021-03-23 / Rev. 10 VV016042 42
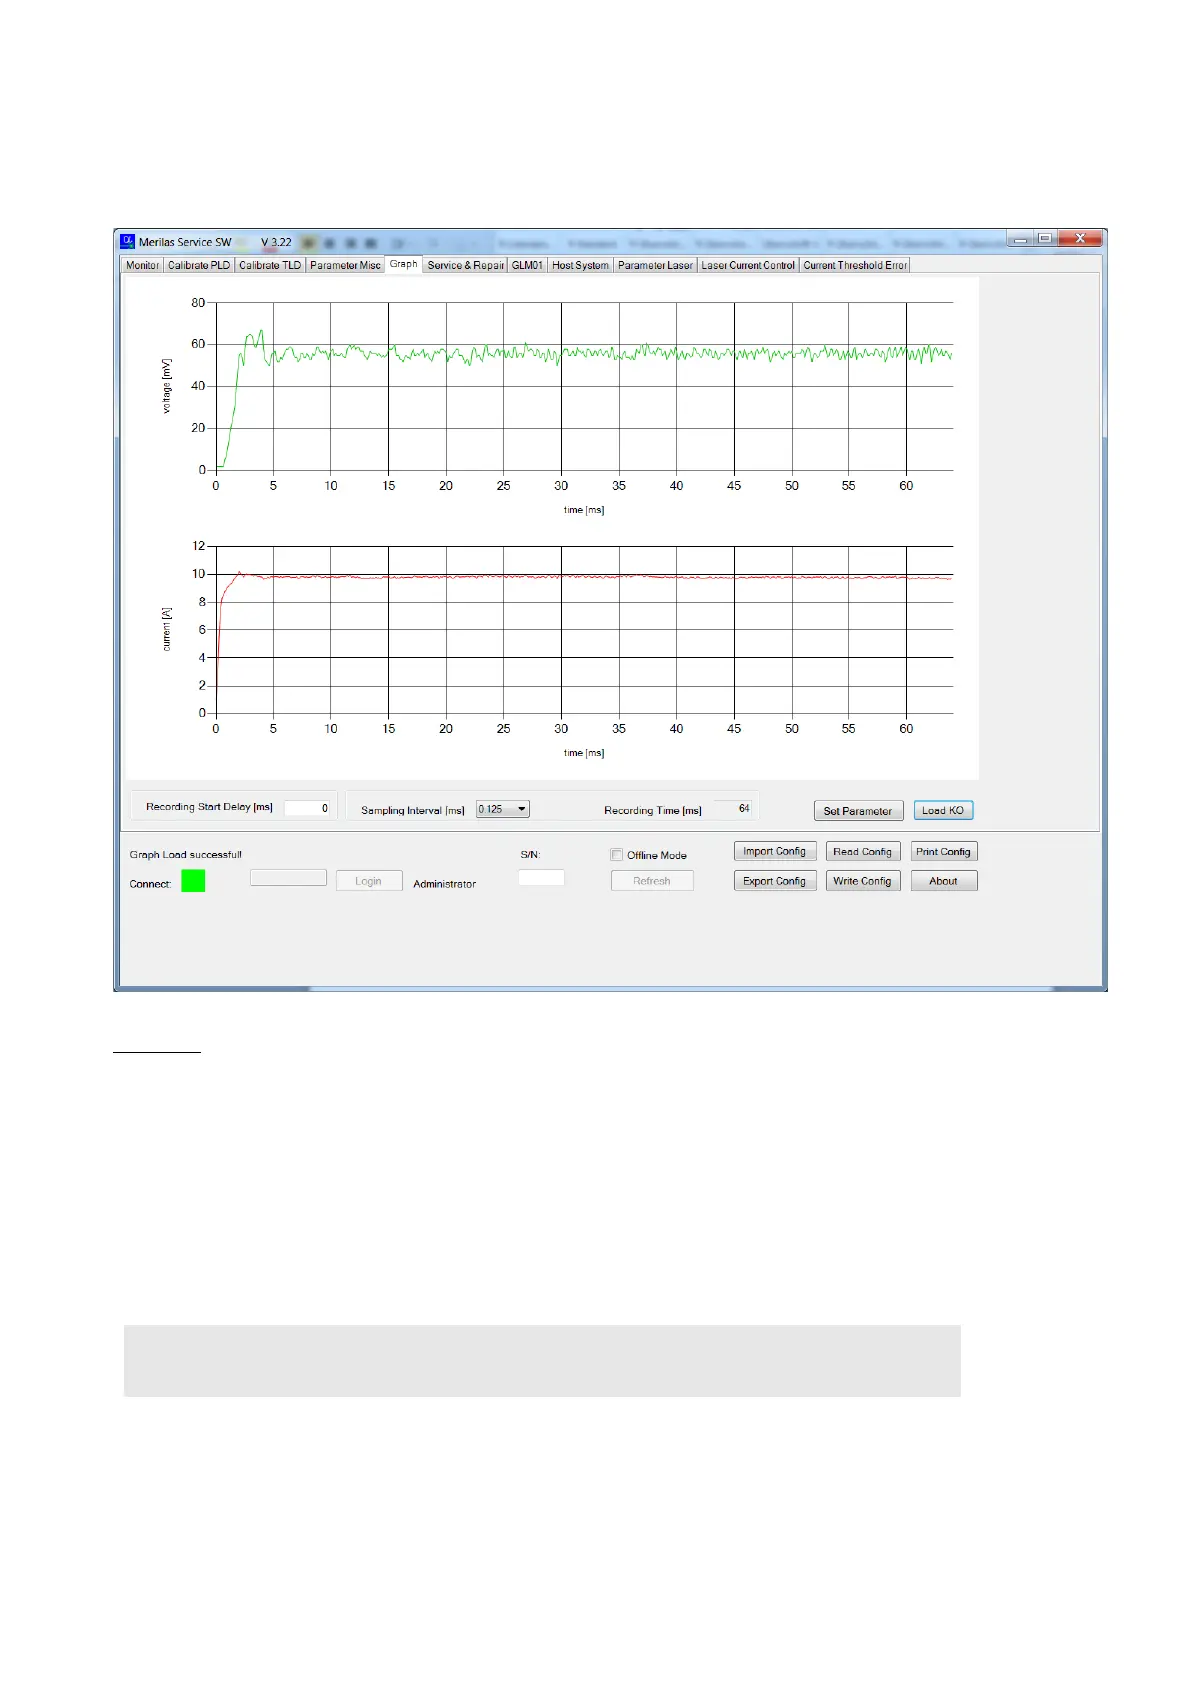
9.7.4.2 How to read the graph
For diagnosis purposes, it can be helpful to check the voltage and current of the PLD. In this case, the transient response
can be recorded.
Procedure:
1. Define the recording start delay and the recording time. The default values normally work.
2. Click <Set Parameter>
3. Change to tab “GLM-01”, and enable GLM01
4. Click <System On>
5. Select relevant laser settings. See “Functional Test” documents for settings
6. Click <Laser On> Laser will start preheating
7. Fire the Laser via the service foot pedal
8. Change to the tab “Graph”
9. Click <Load Ok>
10. Safe each graph according to the “Functional Test” ( 19)
 Loading...