SECTION 5: DETECTING SOPHISTICATED TRANSMITTERS
83 REI OSC-5000E
SECTION 5: DETECTING SOPHISTICATED
TRANSMITTERS
The OSCOR is extremely reliable at automatically detecting and logging continuous
transmission signals in the automatic mode; however, some digitally modulated
sophisticated transmitters will not be automatically logged in automatic mode. To be
more specific, AM, FM, and Sub-carrier modulated signals are easily logged
automatically, but a Burst Transmitter, a Frequency Hopper, and many Spread Spectrum
signals will not be logged in the OSCOR automatic mode because there is no stable
carrier frequency for the OSCOR firmware to lock onto. Therefore, an additional
procedure using the OSCOR Peak Display is required.
The OSCOR Peak Display Mode goes beyond this normal Spectrum Display Function to
provide increased functionality. This function is a unique memory buffer that is
continuously updated. In other words, no matter what the user is doing with the OSCOR
or whether or not the OSCOR is in manual or automatic mode, the OSCOR Peak
Display memory buffer is constantly being updated. Therefore, if energy is captured from
a short transmission such as a Burst or Frequency Hopper, the evidence of this event is
stored in memory in the Peak Display Memory buffer even if the Peak Display is not being
displayed. Furthermore, the Peak display mode and the Friendly Trace provide an
excellent opportunity to quickly see the difference between the RF spectrum traces
between two different locations.
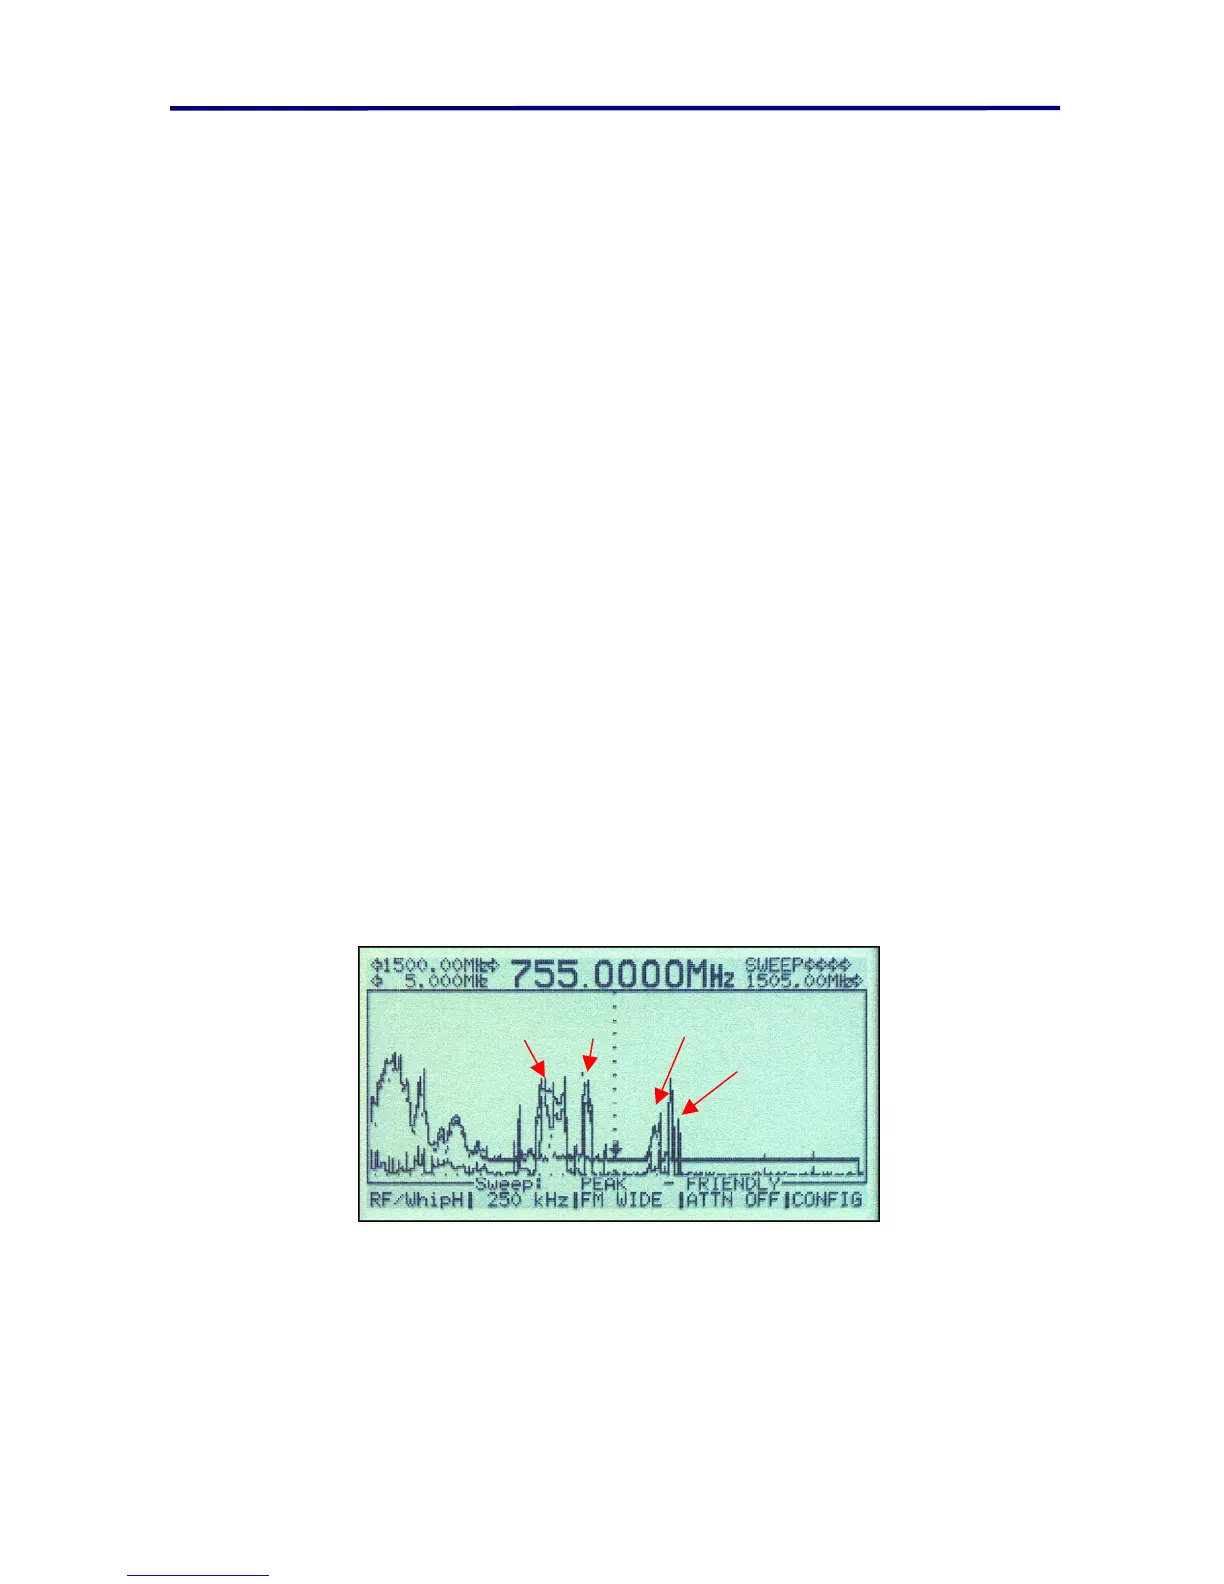
Below is an example of the Peak and Real-time sweep display.
Frequency
Hopping
Threat
Pager Signal
Cell Phone Band
Burst
Transmitter
FIGURE 59 PEAK MINUS FRIENDLY DISPLAY
In this figure, the top portion of the graphic shows the stored Friendly and Peak traces.
The graphic on the bottom shows the difference between these two traces. In this
example, two threats (Frequency hopper, and Burst transmitter) were introduced into the
environment to demonstration the OSCOR function. These signals are labeled on the
graph and will be discussed in the further sections in more detail.