Chapter 2. Displaying Data
58 DigitalFlow™ DF868 Multipurpose Ultrasonic Liquid Flowmeter Programming Manual (2-Channel)
2.4.2 Using the GRAPH Format
While viewing data in the GRAPH format, the function keys are programmed to permit a variety of actions. These
options are described in detail below.
At any given time, 120 data points will be shown on the GRAPH screen. The cursor, which is displayed as a vertical line
that extends the full height of the graph window, can be used to select any one of these data points.
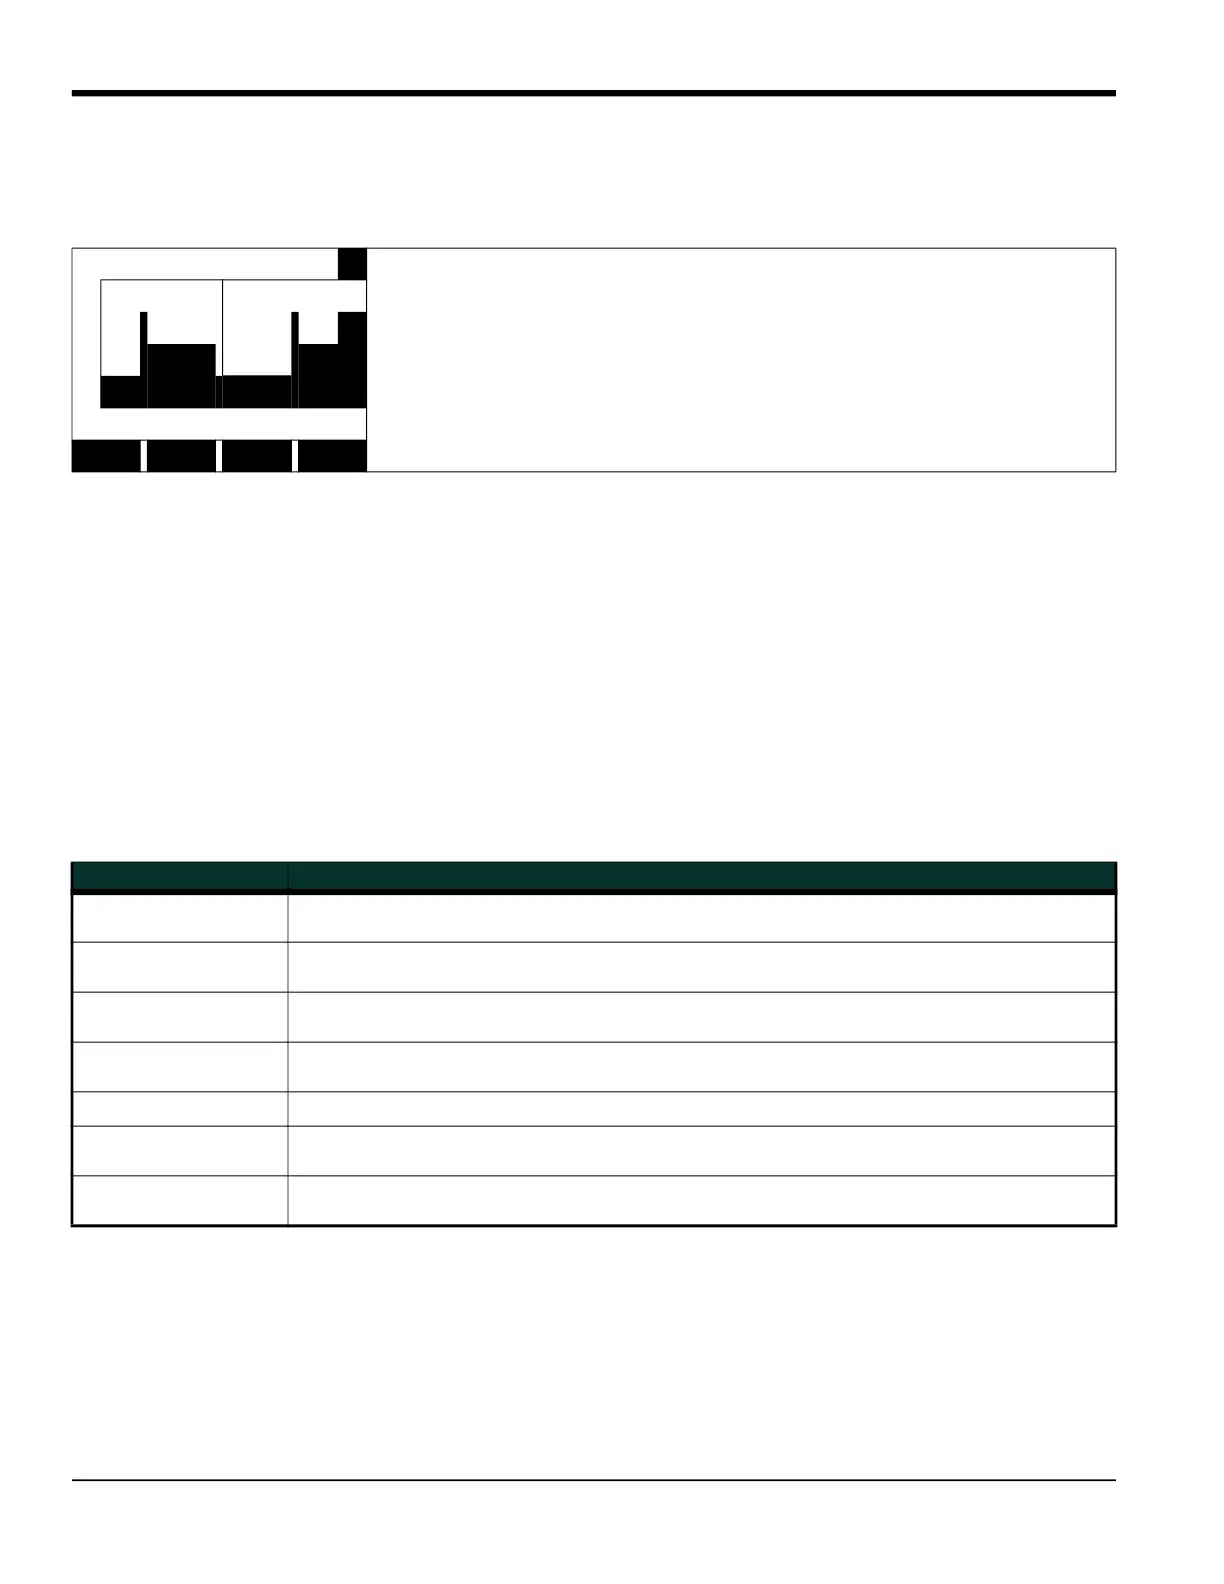
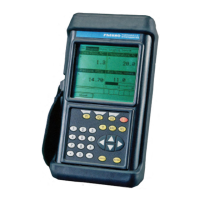
The typical screen shown above is for a Velocity vs. Time graph with only the positive y-axis displayed. The
measurement parameter (VEL) is shown to the left of the y-axis and there is a message line below the graph that
initially indicates the starting date and time of the graphed data. Notice that most of the locator bar has been
replaced by a status line in standard video that shows the value, units and time of the measurement at the current
cursor location. However, there is still an inverse video pointer at the far right of this line to indicate that additional
option bar choices are available.
Note: The date in the message line includes only the day and the month (not the year), and the times in the status
line and the message line include only the hours and minutes (not the seconds).
Because the times displayed in the GRAPH format are in whole minutes only, movement of the cursor may not result
in a visible change in the posted times. For example, if a TIME INCREMENT of 30 seconds has been programmed, two
presses of either cursor movement key will be required to change the displayed time by one minute.
1.23 Ft/s 10:16
‰
Use the [
, [ and [F1]-[F4] keys to select the desired option. See Table 28 for
a listing of the available choices.
V
E
L
ST: 08 MAR 09:50
<CURS CURS> START END
Table 28: Graph Display Options
Option Bar Choice Description
[F1] = <CURS Moves the cursor to the left and displays the corresponding measurement value and time
in the status line: (i.e. 6.85 Ft/s 10:38)
[F2] = CURS> Moves the cursor to the right and displays the corresponding measurement value and
time in the status line: (i.e. 5.31 Ft/s 10:38)
[F3] = START Moves the cursor all the way to the left side of the graph and posts the starting date and
time in the message line: (i.e. ST: 08 MAR 10:38)
[F4] = END Moves the cursor all the way to the right side of the graph and posts the ending date and
time in the message line: (i.e. END 08 MAR 11:14)
[
+ [F1] = YMAX
Displays the programmed maximum Y value in the message line: (i.e. YMAX 25.0 Ft/s)
[
+ [F2] = T INC
Displays the programmed time increment value in the message line:
(i.e. T INC 30 seconds)
[
+ [F3] = EXIT
Leaves the GRAPH format and returns the display to the previous data format. (The [EXIT]
key on the keypad will also perform this function.)