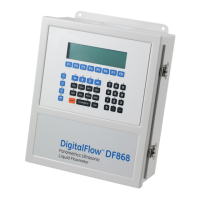
DigitalFlow™ DF868 Multipurpose Ultrasonic Liquid Flowmeter Programming Manual (2-Channel) 57
Chapter 2. Displaying Data
2.3 The DUAL Submenu
The DUAL format displays two measurements simultaneously in normal print. To select the DUAL format and the
measurements to display in this format, follow the instructions in this section.
Upon power up, a standard measurement mode display appears in BIG format. Press the appropriate side of the
[SCREEN] key to activate the desired pane of the display screen, and complete the following steps:
1. To access the Display Menu, press the [DISP] key.
2. Press [F2] = DUAL. The measurement mode display reappears and the display is now in the DUAL format.
3. Use the [F1]-[F4], [
and [ keys to select the desired display parameter option. See Table 27 for a complete
description of the available options.
With the DUAL format display screen active, when a measurement parameter is selected, the top line of the prompt
area will be changed to show that parameter. The parameter previously displayed at the top of the display is moved
to the bottom of the display, and the previous bottom parameter is no longer shown.
2.4 The GRAPH Submenu
The GRAPH submenu permits the display of either the flow velocity, mass flow or the volumetric flow on an XY bar
graph, with a specified time interval on the x-axis. This section describes the procedures for setting up and using the
graph format.
2.4.1 Setting Up the GRAPH Format
Press the appropriate side of the [SCREEN] key to activate the desired pane of the display screen, and complete the
following steps:
1. To access the Display Menu, press the [DISP] key.
2. Press [F3] = GRAPH.
3. Press [F1]-[F3] to graph the Flow Velocity, Volumetric Flow or Mass Flow, respectively.
4. Use the [
, [ and [F1]-[F4] keys to select the desired Time Increment.
5. Enter a maximum value for the Y-axis (vertical) scale that is larger than the maximum expected reading and
press [ENT].
6. At the Y Range prompt, press [F1] to graph only positive Y values or press [F2] to graph both positive and
negative Y values.
After the Y RANGE is entered, the Model DF868 automatically begins taking measurements and displays them in the
specified graphical format. Proceed to the next section for a discussion of manipulating the graphical display.