DigitalFlow™ DF868 Multipurpose Ultrasonic Liquid Flowmeter Programming Manual (2-Channel) 63
Chapter 2. Displaying Data
2.6 Displaying Transducer Signals (cont.)
The typical display screen shown has the Sup transducer signal listed to the left of the y-axis and there is a message
line below the graph that initially indicates the starting date and time of the graphed signal. Notice that most of the
locator bar has been replaced by a status line in standard video that shows the signal amplitude and the time (in
microseconds) of the measurement at the current cursor location. However, there is still an inverse video pointer at
the far right of this line to indicate that additional option bar choices are available. See Table 33 for a complete
description of the nine functions available on the option bar.
In addition to the functions available on the option bar, some of the numeric keys are used to specify which
transducer signal is displayed and to scale the resulting graph. Table 34 lists these functions.
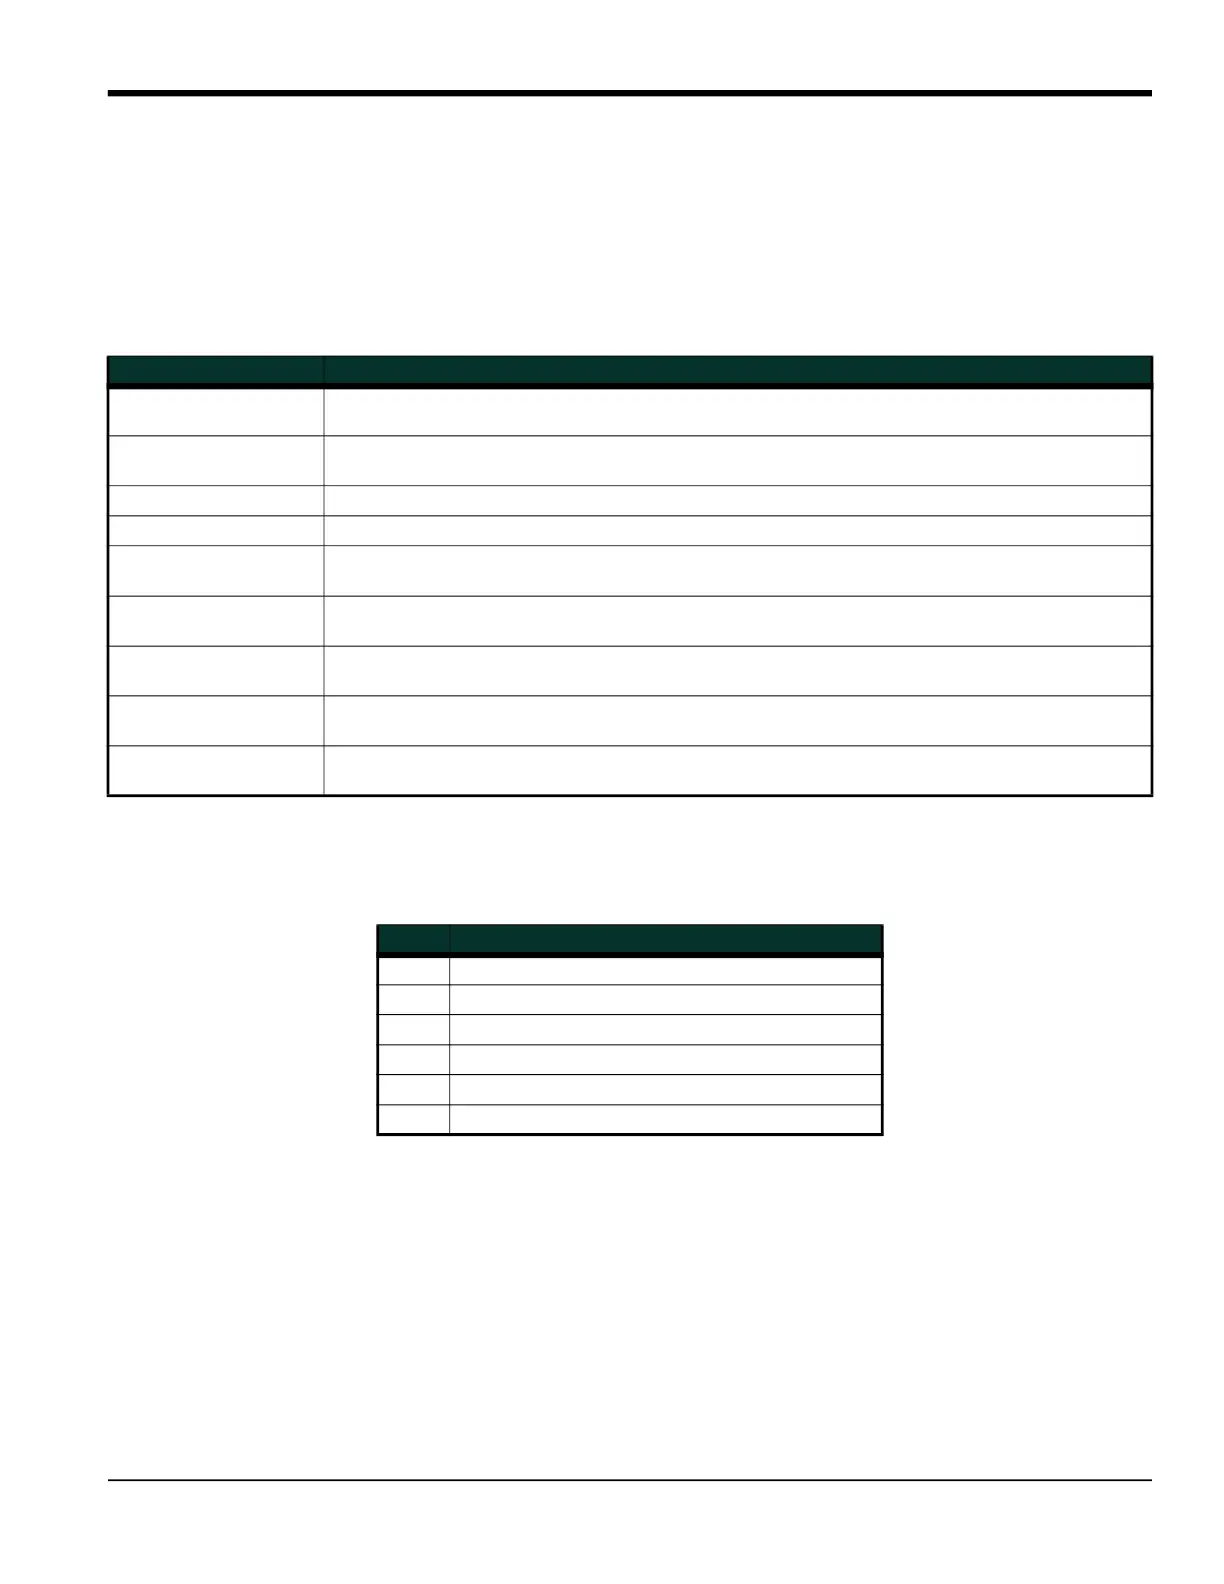
Table 33: Graphical Log Display Options
Option Bar Choice Description
[F1] = <CURS Move the cursor to the left and display the amplitude and time in the status line:
(i.e. 107 686.798mi)
[F2] = CURS> Move the cursor to the right and display the amplitude and time in the status line:
(i.e. 107 686.798mi)
[F3] = <PAGE Display the previous page
[F4] = PAGE> Display the next page
[
+ [F1] = START
Move the cursor to the start of the current page and post the starting date and time in the
message line: (i.e. ST: 451.798usec)
[
+ [F2] = END
Move the cursor to the end of the current page and post the ending date and time in the
message line: (i.e. END: 744.298usec)
[
+ [F3] = YMAX
Display the maximum Y value, which is set to 128 divisions in arbitrary units, in the
message line.
[
+ [F4] = T INC
Display the time increment value in the message line. This is based on the
frequency of the transducers and would equal 0.125 sec for a 1 MHz transducer.
[
+ [F1] = EXIT
Leave the graphical SIGNL display and return the display to the previous data format. (The
[EXIT] key on the keypad will also perform this function.)
Table 34: Numeric Key Functions
Key Function
1 Scroll down the transducer signal list
2 Scroll up the transducer signal list
4 Expand the graph vertically
5 Return expanded graph to previous size
7 Compress graph horizontally
8 Return compressed graph to previous size