105
Displaying data in graphs
Energy saving
Displaying data in graphs
This chapter explains how to display graphs.
This unit is equipped with the functionality to collect the data accumulated in the devices and to turn this into
graphs.
Making the data visible makes it possible to objectively manage energy saving.
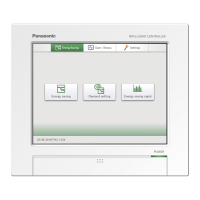
Screen menu Overview Page
Bar chart
Quantities of energy usage (electricity, gas), etc., are shown in bar charts. 109
Line graph
Temperature changes, etc., are shown in line graphs. 113
 Loading...