106
Displaying data in graphs
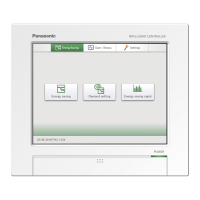
Energy saving
Graph display function
This unit is equipped with a “graph display” function as part of the energy saving functionality.
Collect data from devices such as the indoor units, outdoor units, and pulse meters, set the display period
(daily, monthly, or yearly) and display the graphs.
Types of graph
There are 2 types of graph that you can display on this unit.
Bar charts Line graphs
Display example
Main uses
Comparing accumulated data (thermostat ON operating times,
etc.)
Comparing temperature changes, etc.
Graph settings
The following settings are necessary to display graphs.
( are items that can be set)
Display period
Display period Bar Line Explanation
days
The transition of daily data is displayed in hourly units (1 hour).
Mths
The transition of monthly data is displayed in daily units (1 day).
Yrs.
The transition of yearly data is displayed in monthly units (1 month).
Display method
Display method Bar Line Explanation
Ranking
Display the 10 top best or worst units based on collected values for the item.
By unit
Data by item is displayed for units. (items are xed)
UntCmpar
Display the data for items by unit (you can select up to 4 devices).
ItemUnts
ChngPrDy
The three days’ worth of data for items and units from the day before the previous day, the previous day, and the
same day is displayed.
UserSlct
You can select items freely.
Unit
Unit Bar Line Explanation
I/D
Set indoor unit as the display target.
O/D
Set outdoor unit as the display target.
Pulse
Set accumulator (pulse meter) as the display target.
Ar.
Set area group as the display target.
 Loading...