120
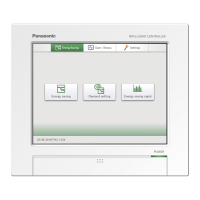
Displaying data in graphs
Energy saving
Displaying a registered graph
1
In the main screen, touch the number of
the “Graph group” to be displayed.
1
2
Touch [GrphDspSetgs].
z The display settings screen is displayed.
2
3
Set the display range.
z For details, refer to step 4 in “Graphing operating times and
energy usage” (P.109) for bar charts, or step 4 in “Graphing
temperature changes” (P.113) for line graphs.
4
Touch [GraphDsp].
z The graph is displayed in the main screen.
z To cancel the settings, touch [Cancel].
Note
y By touching the graph group numbers displayed in the
graphs, you can display other registered graphs.
Modifying a registered graph
1
Touch the number of the “Graph group”
to be displayed.
1
2
Touch [GrphDspSetgs].
z The display settings screen is displayed.
2
3
Change the settings.
z For advanced settings for changing the range of display,
refer to step 4 in “Graphing operating times and energy
usage” (P.109) for bar charts, or step 4 in “Graphing
temperature changes” (P.113) for line graphs.
z For advanced settings for changing the display items, refer
to steps 5 to 12 in “Graphing operating times and energy
usage” (P.110 to 111) for bar charts, or steps 5 to 11 in
“Graphing temperature changes” (P.114 to 115) for line
graphs.
Continued on next page
Setting items freely
 Loading...