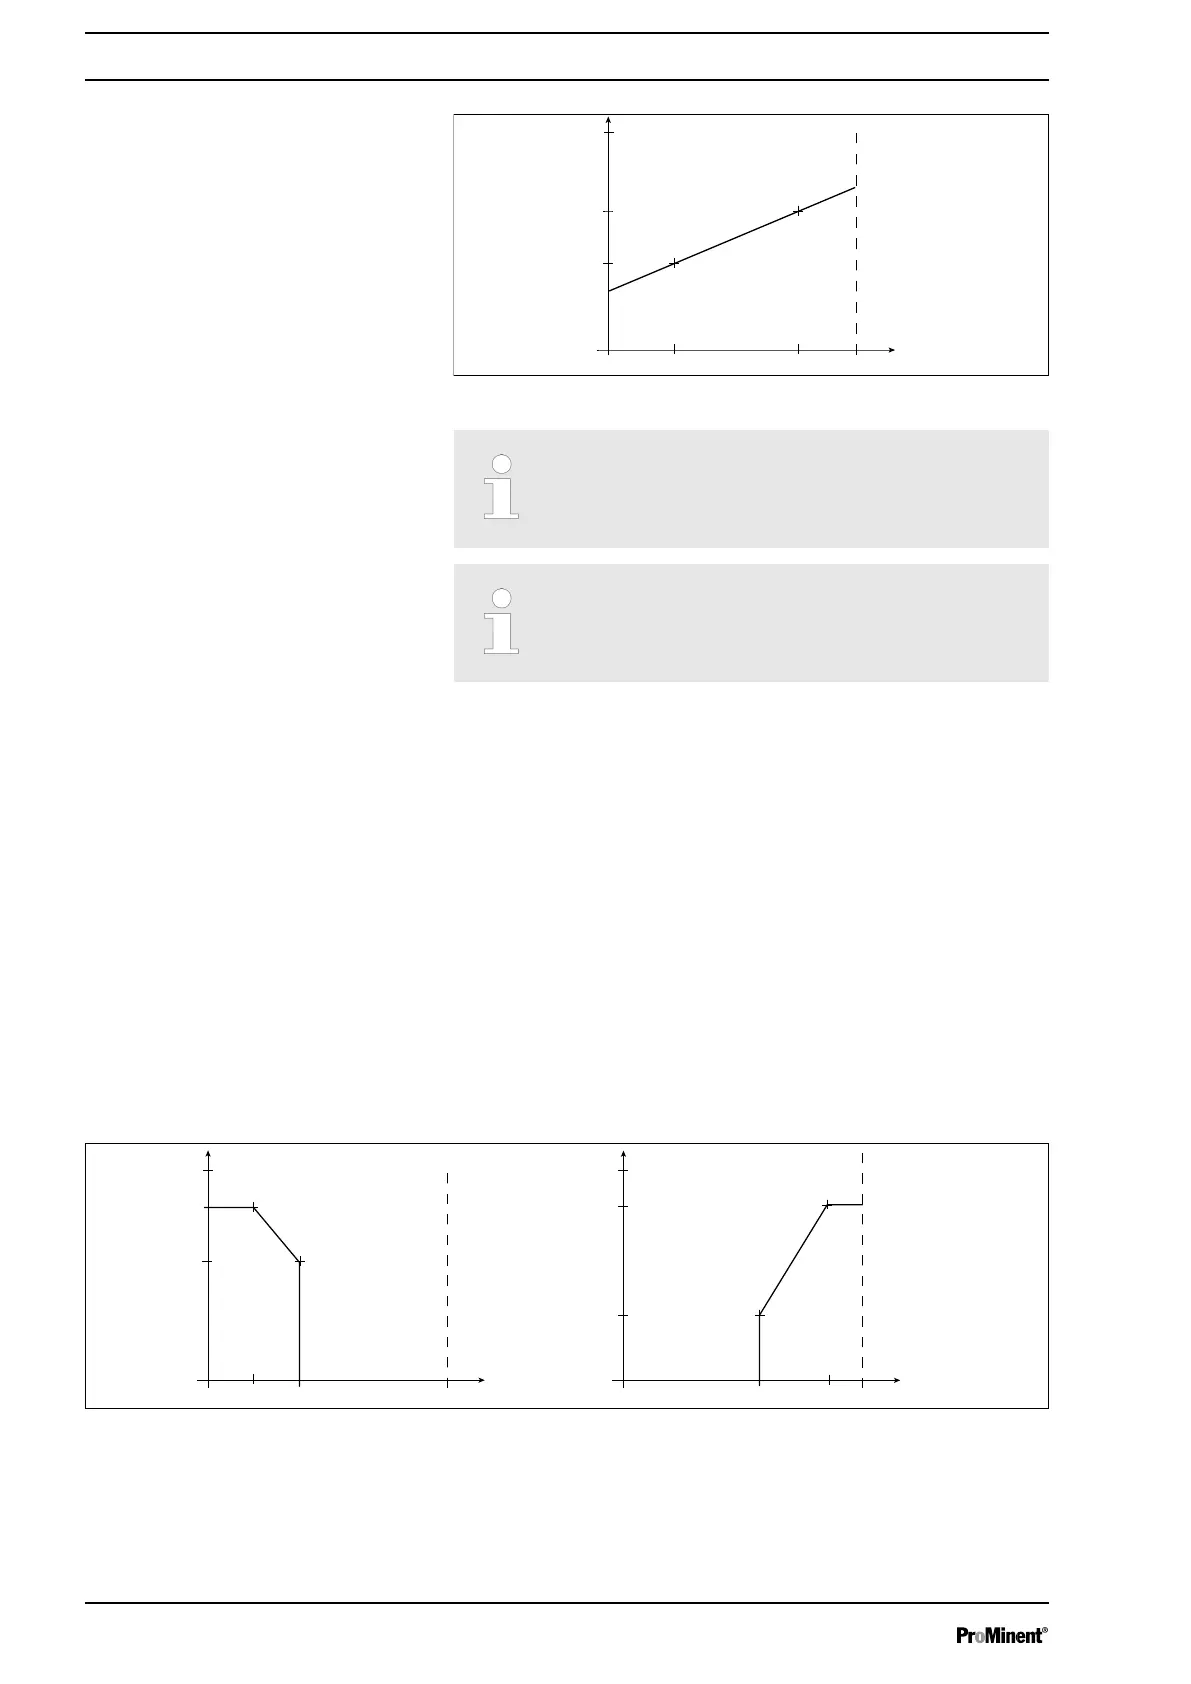
I [mA]
I 1
I 2
F1
F2
Fmax
0 20
P1
P2
B0088
Fig. 33: Frequency-current diagram for "Linear curve"
Plot a diagram similar to the one above – with
values for (I1, F1) and (I2, F2) – so that you can
set the pump as desired!
The smallest processable difference between I1
and I2 is 4 mA (ll I1-I2 ll ≥4 mA).
In the
‘Error message’
menu item, you can activate error pro‐
cessing for these types of processing.
‘Lower side band’
Using this type of processing, you can control a metering pump
using the current signal as shown in the diagram below.
However, you can also control two metering pumps for different
feed chemicals via a current signal (e.g. one acid pump and one
alkali pump using the signal of a pH sensor). To do this, connect
the pumps electrically in series.
In the
‘Error message’
menu item, you can activate error pro‐
cessing for these types of processing.
I [mA]
I 1 I 2
F2
F1
0 20
a)
b)
P1
P2
Fmax
B0089
I [mA]
I 1
I 2
F1
0 20
P1
P2
F2
Fmax
Fig. 34: Frequency-current diagram for a) Lower side band, b) Upper side band
‘Upper side band’
Error processing
Error processing
Set up /
‘Menu’
54
 Loading...