Rockwell Automation Publication 1426-UM001J-EN-P - August 2019 477
EN 50160 Conformance Tracking Appendix H
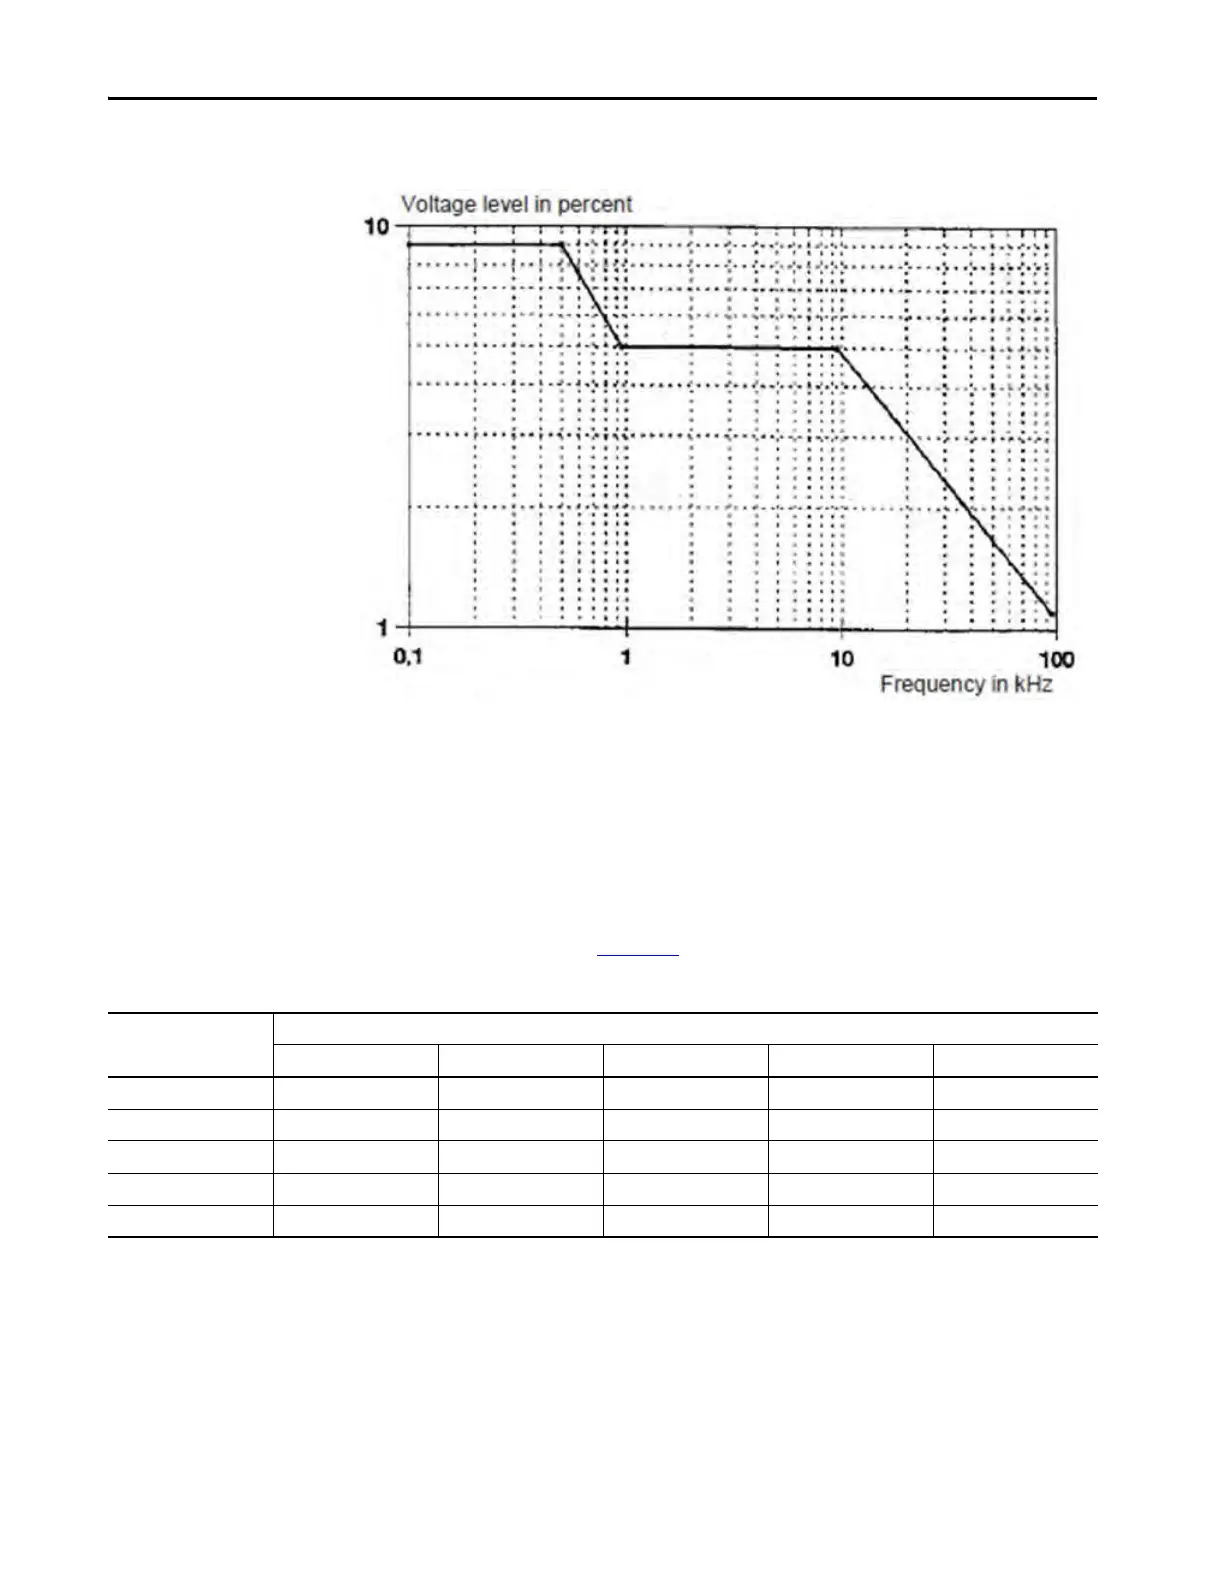
Figure 52 - Voltage Levels of Signal Frequencies in Percent of Nominal Voltage UnUsed in Public
Networks
Voltage Dips (sags)
The power monitor records voltage dips when the line-to-neutral voltage (for
Wye and split-phase metering modes) or line-to-line voltage (for Delta systems)
drops below 90% of its nominal value. The duration and residual voltage (the
minimum value during the event) are used to classify voltage dips by using the
categories shown in Table 230
.
Table 230 - Classification of Dips According to Residual Voltage and Duration
Residual Voltage, u %Duration, t ms
10 ≤ t ≤ 200 200 < t ≤ 500 500 < t ≤ 1000 1000 < t ≤ 5000 5000 < t ≤ 60,000
90 > u ≥ 80 Cell A1 Cell A2 Cell A3 Cell A4 Cell A5
80 > u ≥ 70 Cell B1 Cell B2 Cell B3 Cell B4 Cell B5
70 > u ≥ 40 Cell C1 Cell C2 Cell C3 Cell C4 Cell C5
40 > u ≥ 5 Cell D1 Cell D2 Cell D3 Cell D4 Cell D5
5 > u Cell X1 Cell X2 Cell X3 Cell X4 Cell X5
 Loading...