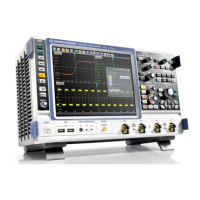
Instrument Tour
R&S
®
RTO
21Getting Started 1316.0833.02 ─ 10
1 = Toolbar
2 = Diagram area
3 = Signal bar with horizontal and trigger label (3a), signal icon with signal label (3b) and signal icon with
minimized live waveform (3c)
4 = Menu bar
5 = Dialog box
6 = Result box
7 = Input box
Toolbar
The icons on the toolbar provide quick and easy access to the most important function-
ality. For a detailed description, refer to chapter 5.3, "Toolbar", on page 76.
Diagram area
The diagram area shows the diagrams with waveforms. For a detailed description,
refer to chapter 5.2, "Information on the Display", on page 72.
Signal bar
The signal bar is the control center for all enabled waveforms. On the top, the horizon-
tal and trigger labels show the main time base and trigger settings.
Below, each waveform is represented by a signal icon. For an active waveform, that is
shown in a diagram, the signal icon displays the signal label with the main vertical and
acquisition settings for the waveform. If you tap the "Minimize" icon on the signal label,
the waveform switches from the diagram area to the signal icon: the icon shows the
real-time preview of the waveform. If you touch and hold a signal label, the dialog box
with vertical settings for this waveform opens. See chapter 5.4, "Working with Wave-
forms", on page 82 for a detailed description.
You can also adjust the behavior of the signal bar in various ways, see chapter 5.6,
"Using the Signal bar", on page 87.
Menu bar
The menus provide access to the complete functionality of R&S RTO.
Dialog box
The tabs of the dialog boxes contain all task-oriented settings and operations, and
black buttons for calling related tabs. The usage of dialog boxes is described in chap-
ter 5.7, "Accessing the Functionality", on page 89.
Result box
If you perform manual or automatic measurements, mask testing, or a search, the
result box shows the results of the action. Similar to waveform diagrams, you can mini-
mize the result box to a result icon on the signal bar, and display results in a separate
diagram on the screen. The icon opens the corresponding dialog box to adjust the
settings.
For details, see chapter 5.5, "Displaying Results", on page 86.
Front Panel

 Loading...


