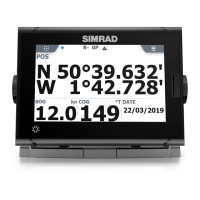
Simrad CS66
72 20221859 / F
6.10 Tidal predictions
C-Map
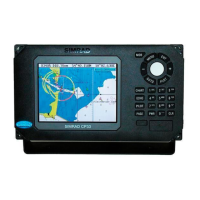
The C-MAP Professional + chart database contains about 4000
tide prediction points around the world. These predictions points
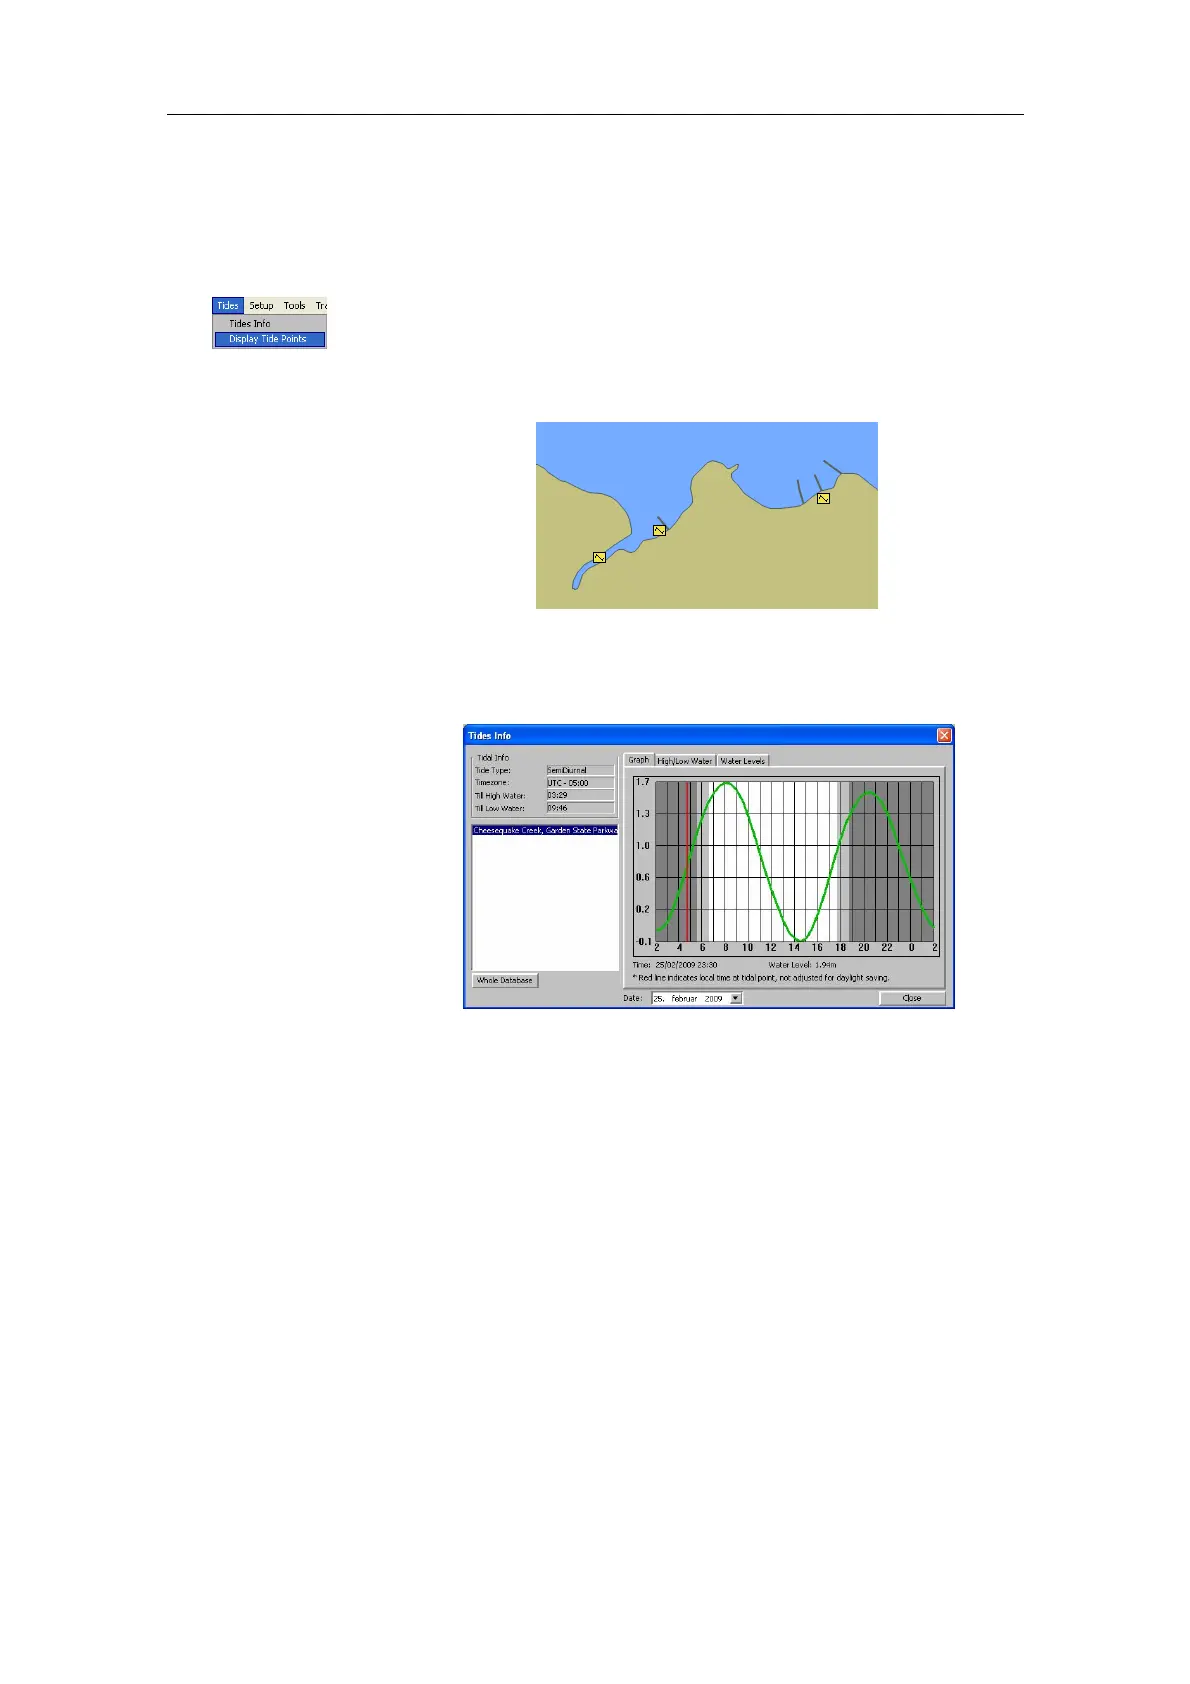
may be loaded and displayed by selecting the Tides menu,
followed by the Display Tide Points command.
Click the right cursor button inside one of these diamonds to see
the tidal prediction for the selected point.
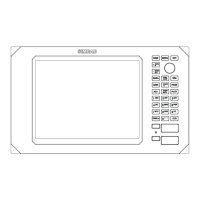
The tidal diagram is calculated for the current date (today), and
the time is standard time for the country concerned. The date is
displayed in the Date field.
Graphic view
A graphic view of the tidal prediction is shown by activating the
Graph tab. This is the default view when the tidal diagram is
opened.
The tidal height is graphically expressed with three background
colors indicating time of the day:
− Dark gray: Night time
− Light gray: Twilight
− White: Daytime
The graphic’s max height is automatically set equal to maximum
tide height.