Paramount GEM User Guide
130 | P a g e
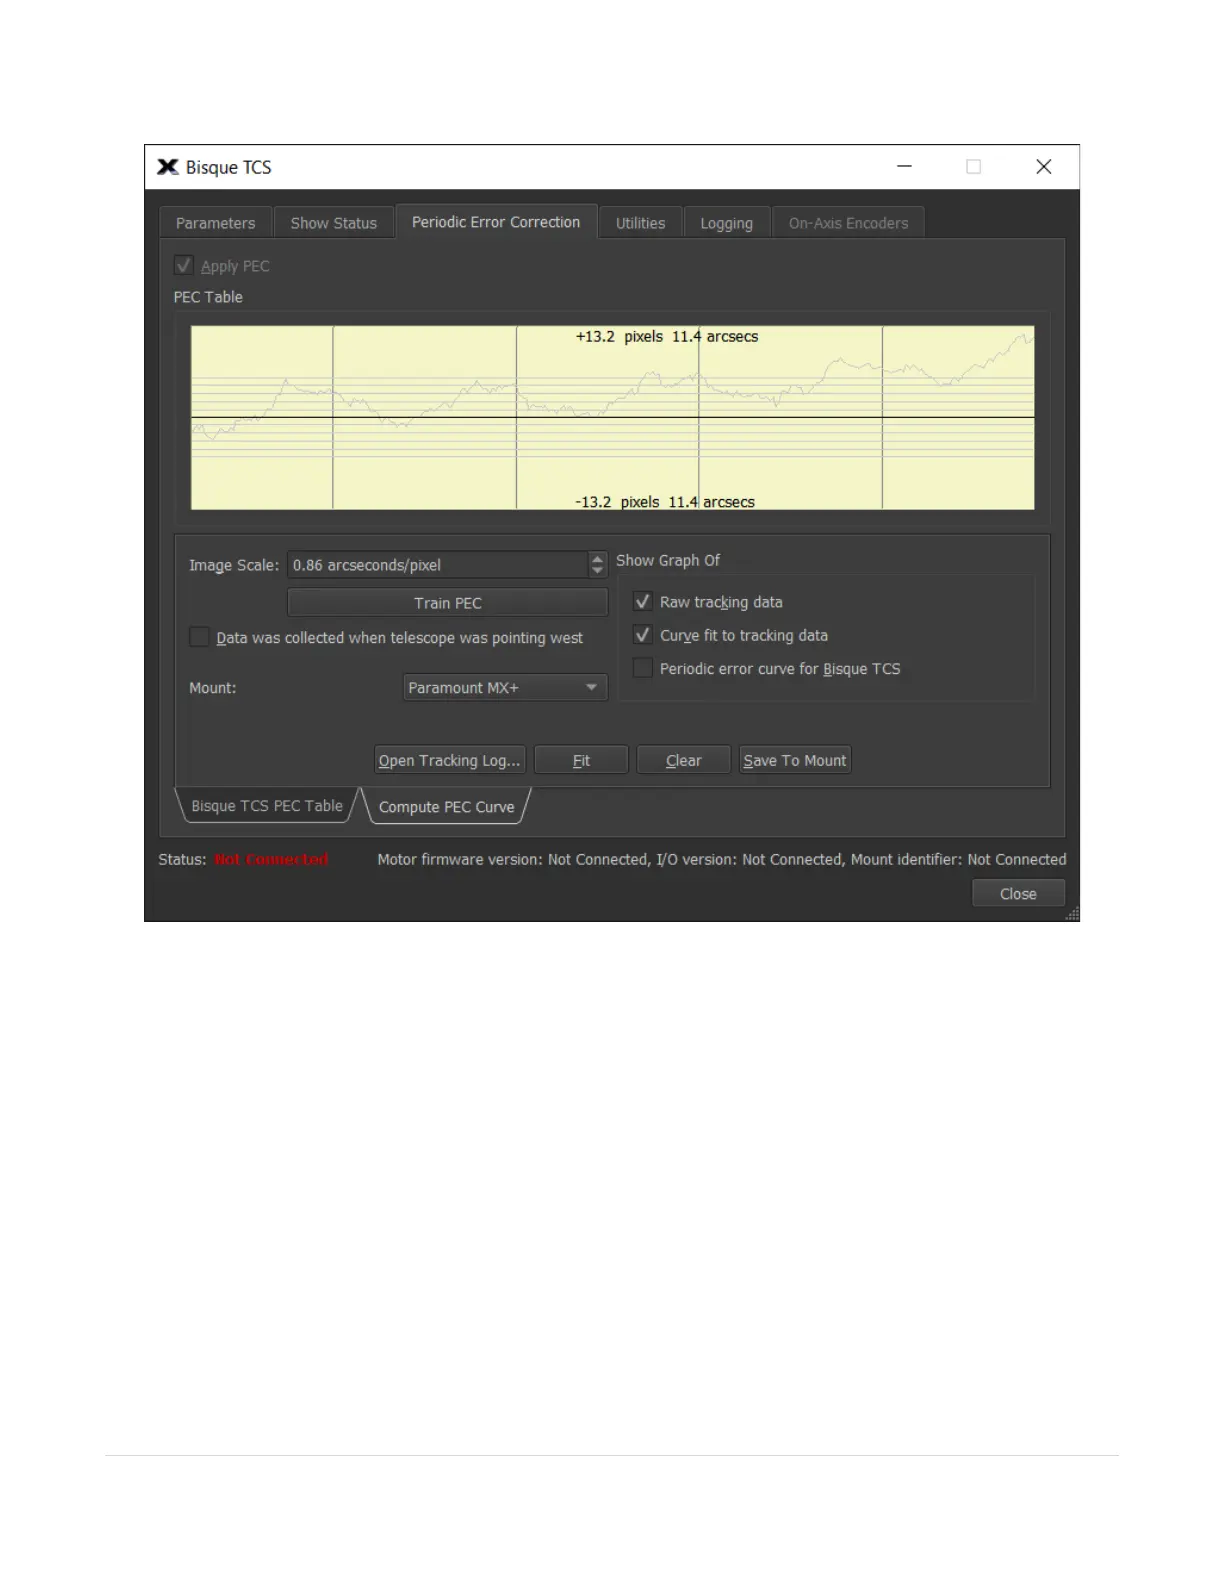
Figure 60: The Compute PEC Curve tab on the Periodic Error Correction tab (Bisque TCS window).
PEC Table Graph
The yellow shaded region can be used to show a graph of the tracking log data, the “best fit” curve to that data
and the actual periodic error curve derived from the best fit curve that is stored to the Bisque TCS flash memory.
Use the mouse scroll wheel to adjust the relative scale of the graph. Scrolling forward expands the scale on the
graph, scrolling backward magnifies the graph.
Image Scale
Enter the image scale of the optical system, in arcseconds per pixel. Image scale is critical for computing the
correct periodic error from the tracking log data. If you are unsure of the photo’s image scale, use TheSky
Professional’s Image Link feature to compute it for you.