16
1-4-2-3. Operation during waveform display
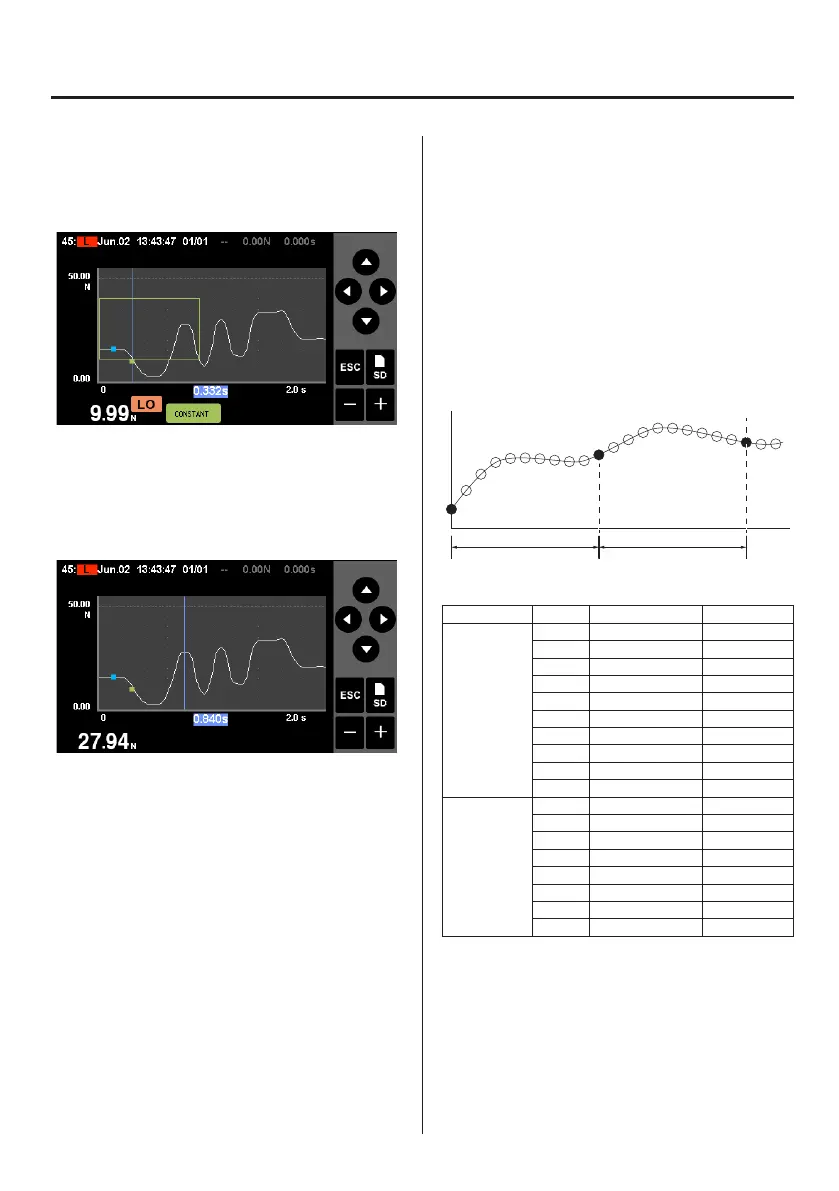
Showing multi-zone judgment hold positions
Touch the 5 button to show the cursor at the zone hold posi-
tion. Use the 5 and b buttons to change the zone shown.
Zone display colors
1: olive, 2: cyan, 3: orange, 4: light yellow, 5: pink
Moving the cursor
Touch the graph to show the cursor at that position.
Use the g and t buttons to adjust the cursor position precisely.
o The point of intersection between the cursor and the hold
position or other measurement waveform position could be
slightly off due to calculation rounding errors, for example.
1-4-2-4. Saved data overview
Rather than saving all sampled data as is, this unit saves data
at intervals.
2240 data points will be saved in the X axis full scale range.
For example, if the X axis is time, and X axis full scale is 800 ms,
saving will occur at 0.4ms intervals (see the table below). For
example, if the X axis is displacement and X axis full scale is
10,000, saving will occur at intervals of 5.
In the following example of data saving, the sampling fre-
quency is 25 kHz, the X axis is time and X axis full scale is
800ms.
o˜: Sampling data
o: Saved data
0.4ms 0.4ms
X axis full scale settings and saving intervals
X axis
Set time Measurement time Saving interval
Time
80ms* 89.6ms 0.04ms
170ms* 179.2ms 0.08ms
400ms 448ms 0.2ms
800ms 896ms 0.4ms
2.0s 2.24s 1ms
4.0s 4.032s 2ms
10.0s 10.304s 4.6ms
30.0s 30.016s 13.4ms
60.0s 60.032s 26.8ms
90.0s 90.048s 40.2ms
Displacement
2000 2240 1.0
4000 4480 2.0
6000 6720 3.0
8000 8960 4.0
10000 11200 5.0
15000 15680 7.0
20000 20160 9.0
30000 31360 14.0
1. Names and functions of parts

 Loading...