Section 6: Make I-V measurements on a solar cell 4200A-SCS Parameter Analyzer User's Manual
6-10 4200A-900-01 Rev. D/April 2020
The sheet displays the results with the voltage and current data labeled Anode V and Anode I,
respectively. The formulas calculated in the Formulator are shown in the right-most columns. They
include the maximum power (PMAX), open circuit voltage (VOC), short circuit current (ISC), and fill
factor (FF). More information about the sheet and Formulator can be found in the Model 4200A-SCS
Reference Manual.
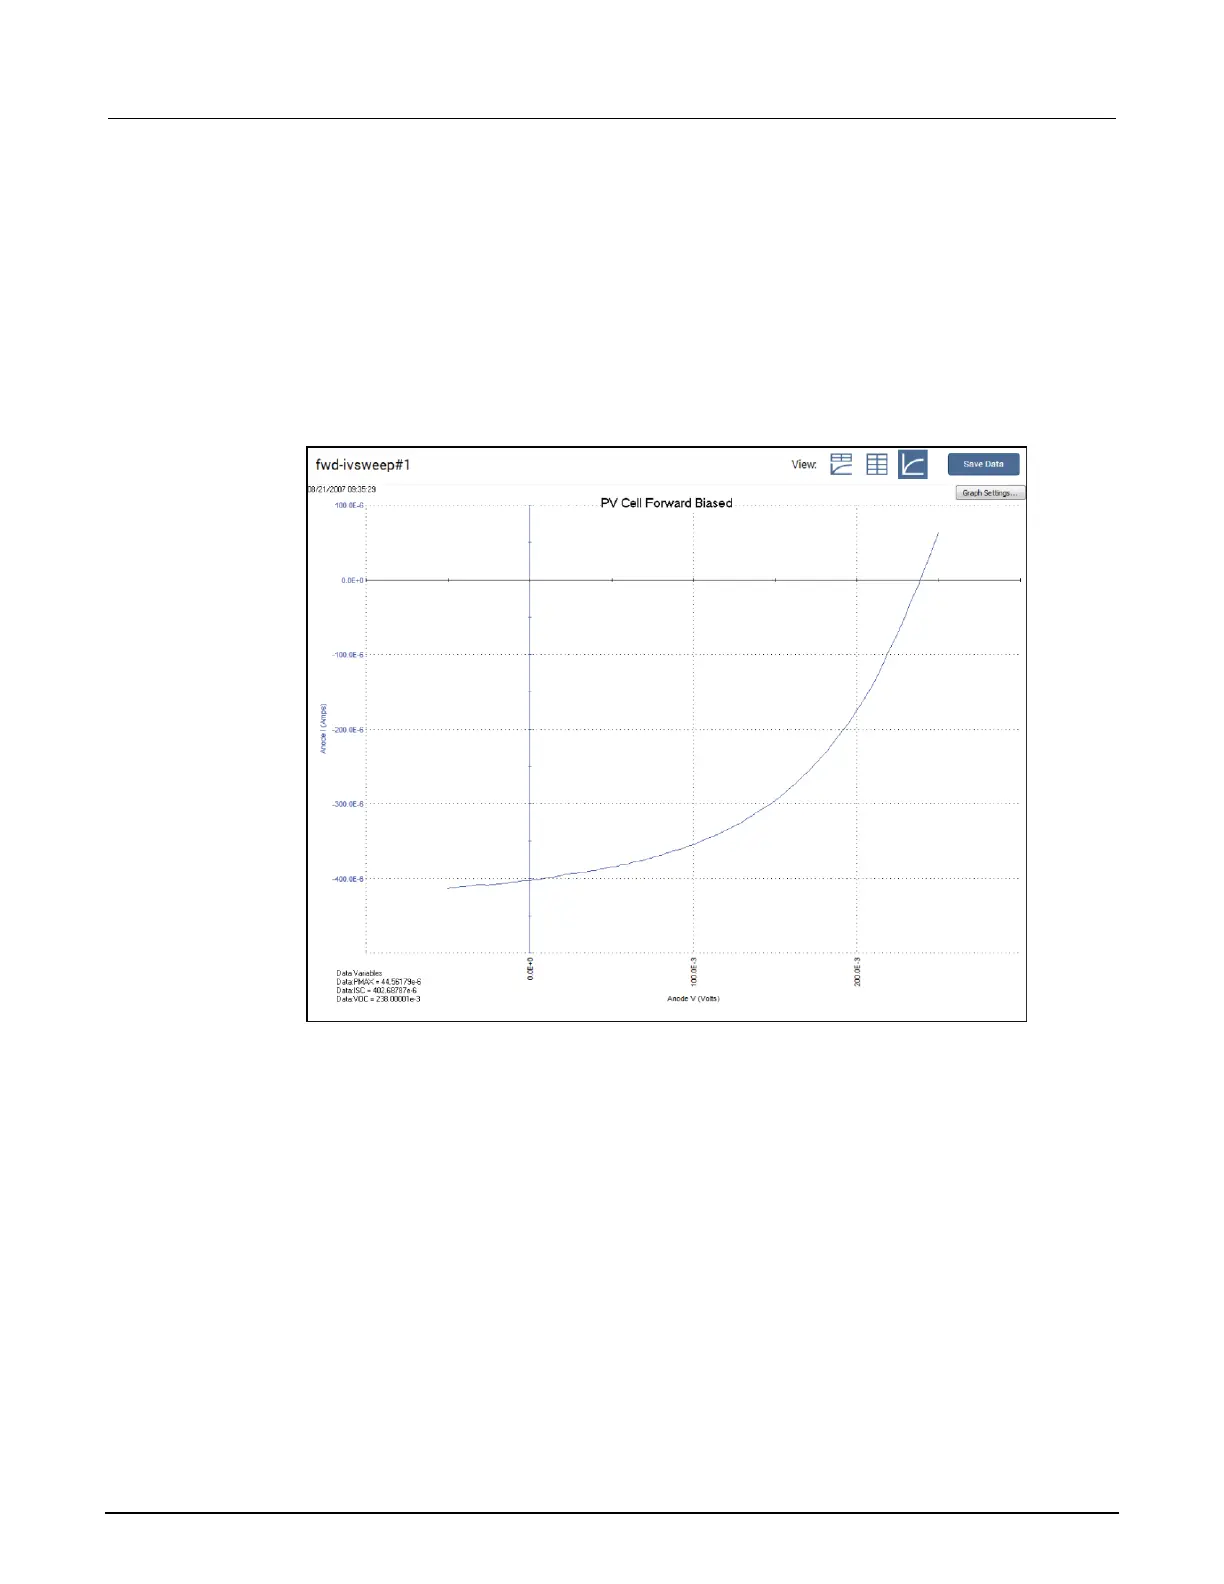
To see an expanded view of the graphed test results, select the graph view. The following graph
shows the sweep of an illuminated silicon photovoltaic (PV) cell generated by the SMU.
Figure 85: Test results showing I-V graph of an illuminated solar cell
Because the system SMUs can sink current, the curve can pass through the fourth quadrant and
allow power to be extracted from the device (I–, V+). If you want to have the data displayed in the first
quadrant, use the Formulator to multiply the current by -1 and plot this calculated result instead.
You can also show previous test runs in the graph window by selecting them under the Run History
tab. Select the check box next to the test you want to display, and the test curves are displayed in the
graph window. If you select multiple run histories, the graphs are overlaid.
Additional tests
You can add other solar cell tests to the project. Search for solar cell in the Tests library to find
additional tests.
ООО "Техэнком" Контрольно-измерительные приборы и оборудование www.tehencom.com
 Loading...