4. Double-tap within a Plot view to open a configuration menu to set display characteristics. Tap the Help icon on the
configuration menu title for more information on that menu's settings. Tap outside the menu to close the menu.
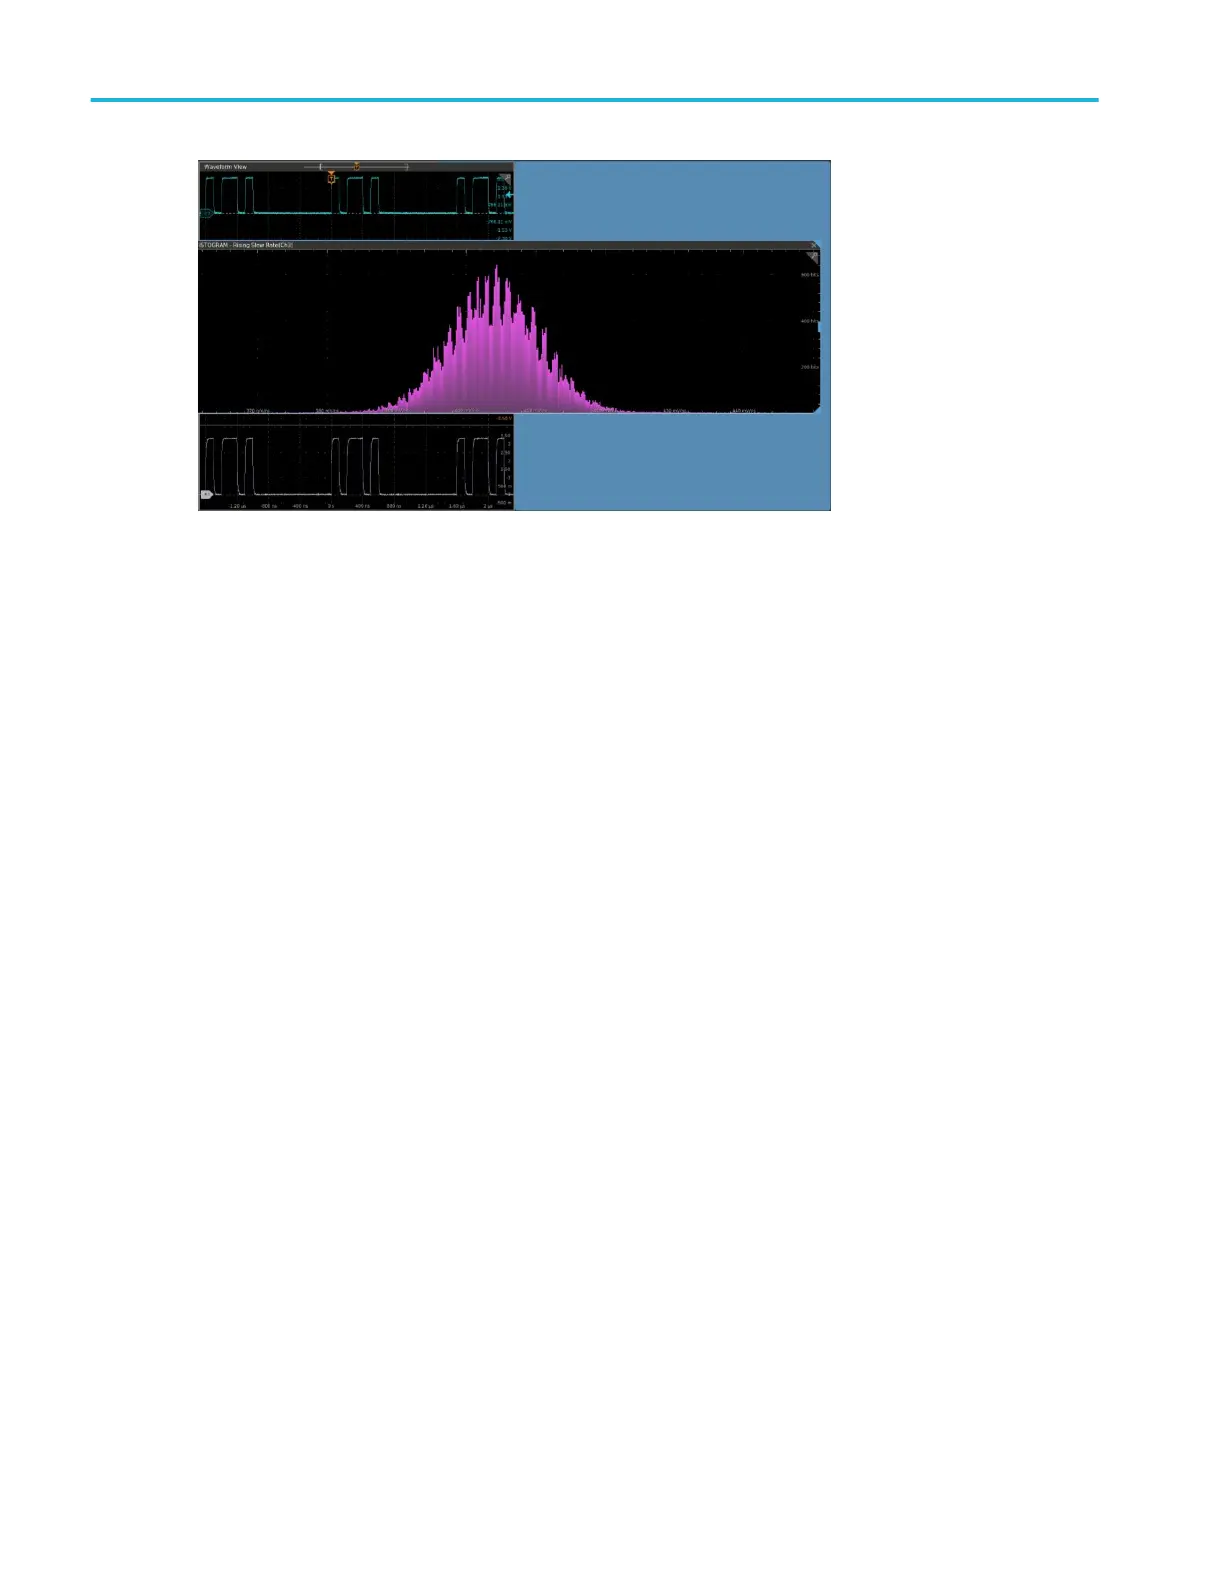
Display a Histogram plot
Use this procedure to display a histogram plot.
To display a histogram plot you must be taking a measurement.
1. Double-tap a measurement badge.
The Measurement configuration menu is displayed.
2. Tap the Histogram plot button.
The Histogram plot is displayed in a separate Plot view.
3. Double-tap in the plot view to open a configuration menu for that plot.
Display a Time Trend plot
Use this procedure to display a time trend plot.
To display a time trend plot you must be taking a measurement.
1. Double-tap a measurement badge.
The Measurement configuration menu is displayed.
2. Tap the Time Trend plot button.
The Time Trend plot is displayed. Time Trend plots are shown in the Waveform View rather than in a separate Plot view.
Analog channel operating basics
100 MSO54, MSO56, MSO58, MSO58LP, MSO64 Help