Recorder Functions
This chapter provides a step-by-step introduction to the recorder functions of
the instrument. The introduction gives examples to show how to use the menus
and perform basic operations.
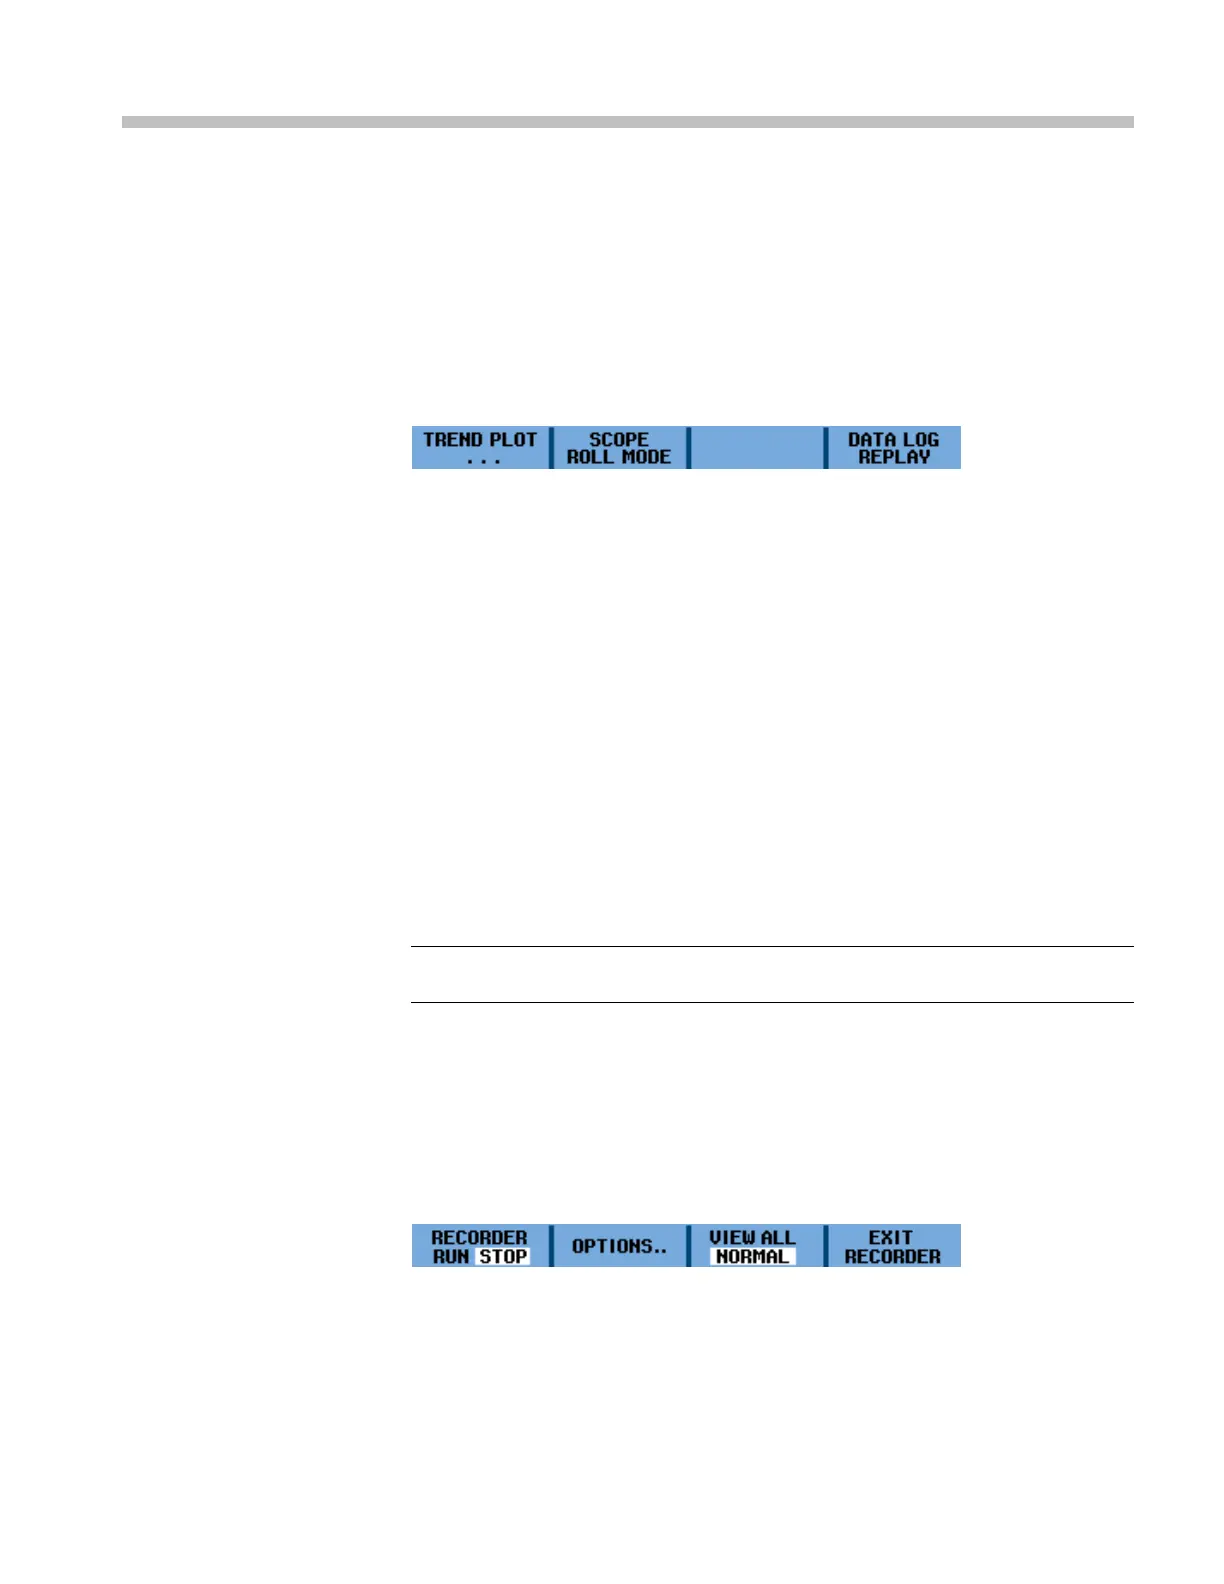
Access the RECORDER REPLAY.. menu by first pressing the Acquire button.
From the RECORDER REPLAY.. menu, you can now choose from the recorder
functions.
Figure 24: RECORDER REPLAY main menu
Plot Measurements Over Time (TrendPlot™)
Use the TrendPlot™ function to plot a graph of measurements as a function of
time. When simultaneously plotting two readings, the screen area is split into
two sections of four divisions each. When simultaneously plotting three or four
readings, the screen area is split into three or four sections of two divisions each.
To start a trend plot, do the following:
1. Make an automatic measurement. The following steps will then plot that
information. (See page 31, Automatic Measurements.)
2. Select RECORDER REPLAY.. from the Acquire button menu.
3. Select TREND PLOT.
NOTE. If autoranging is not on, you will be asked if you would like to turn it on
before plotting. Select YES if you expect wide changes to the input signal.
5. Observe that the word RECORDING is showing in the right top portion of
the display screen. From the menu that appears, you can select a reference
(Time of Day or From Start) from the OPTIONS.. menu. You can also
select to view all data in memory (VIEW ALL) or just the twelve most
recently recorded divisions (NORMAL).
6. Select STOP under the RECORDER menu item to stop plotting.
7. Observe that the recorded time from start appears at the bottom of the display
screen. The present reading appears on the top of the display screen. The
THS3000 Series Oscilloscopes User Manual 47
 Loading...