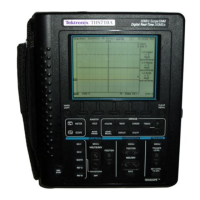
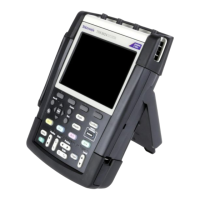
Analyze Waveforms
Analyze Wavef
orms
You can u se th
e Replay, Zoom, and Cursors analysis functions to perform detailed
waveform analyses. These functions can be used with one or more of the primary
functions: Acquire, TrendPlot™, or Data Log Replay.
It is possible to combine two or three analysis functions. A typical application
using these functions is:
First replay the last screens to find the screen o f special interest.
Then zoom i
n on the signal event.
Finally, make measurements using the cursors.
Use Replay
When you are in acquire mode, the instrument automatically stores the 100 most
recent
screens. Records are captured and frozen when you press the Run/Stop
button. You can also use the Replay function to store and view signals even if
you did not press Run/Stop.
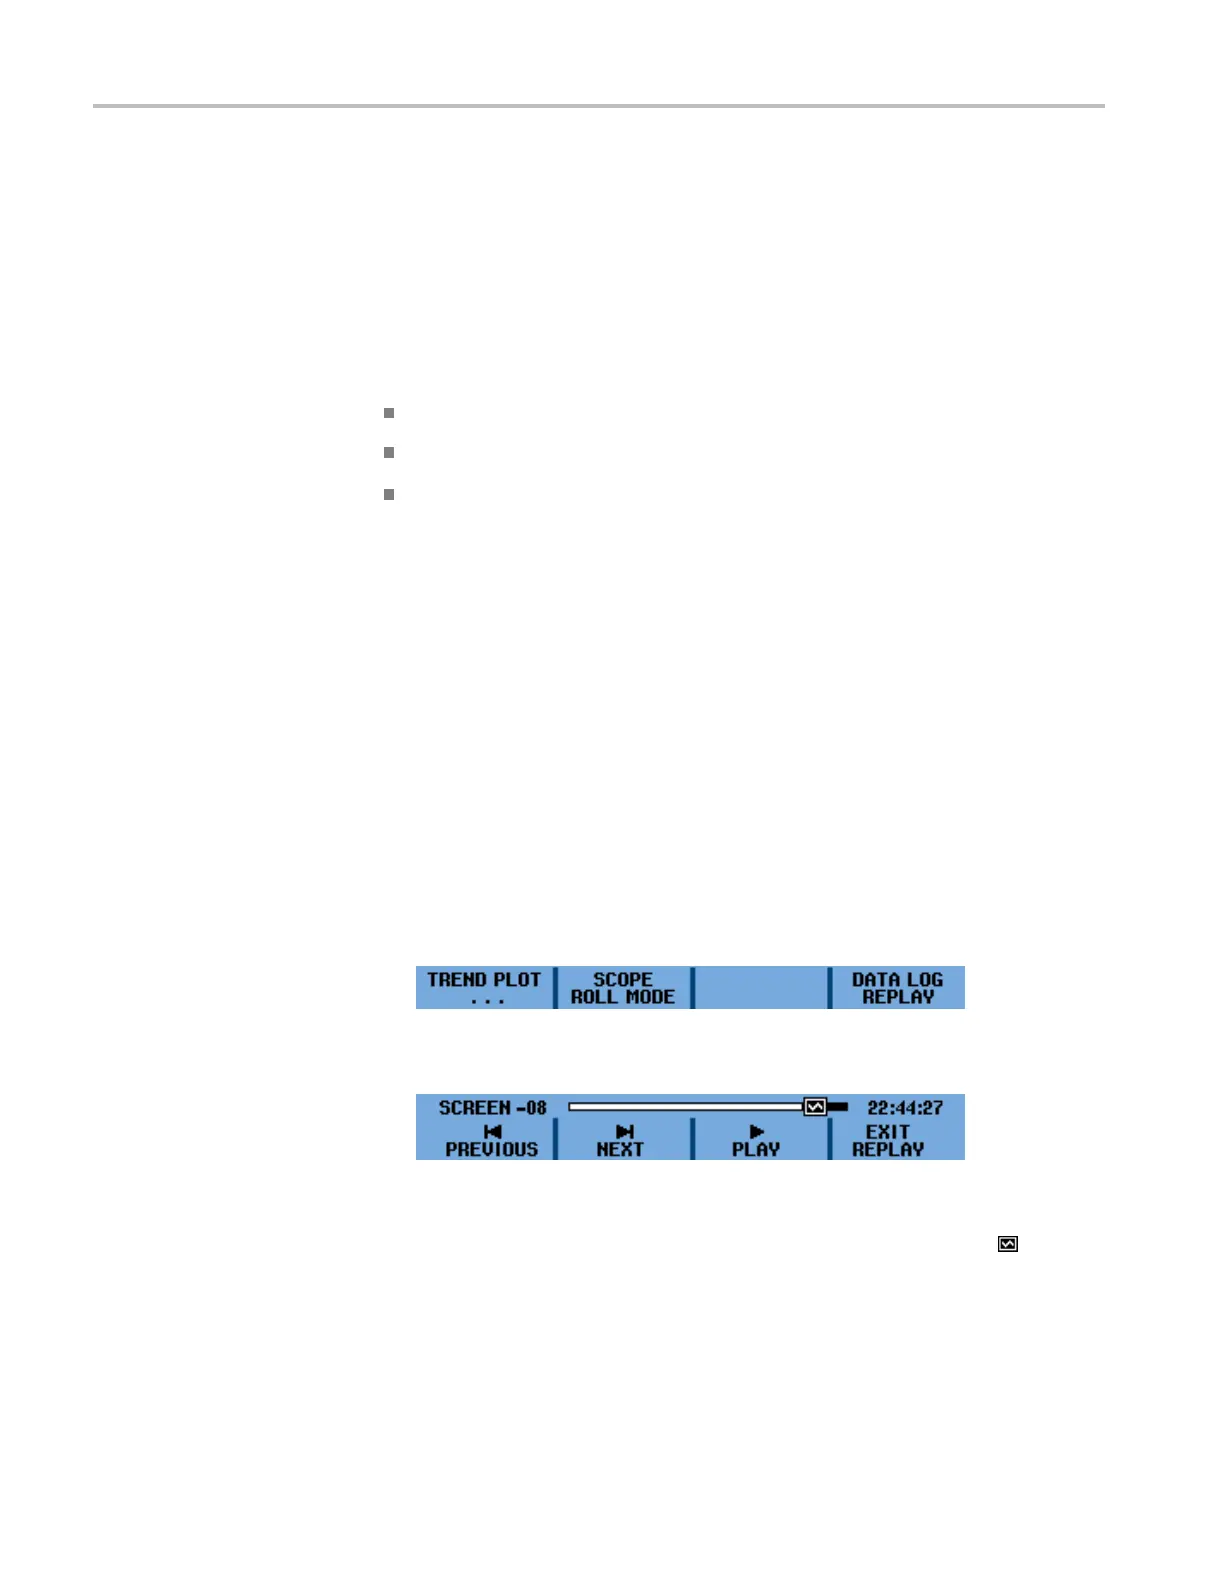
Use the options in the DATA LOG REPLAY menu to review stored screens.
Replay an Acquired Screen
To review a spe cific stored screen, do the following:
1. Press the Acquire button.
2. Select the RECORDER REPLAY.. menu option.
3. Select DATA LOG REPLAY.
4. Select Next or Previous to scroll through the stored screens until you find
the one you want.
5. Observe that the top portion of the DATA LOG R EPLAY menu (shown in
step 4) displays a replay bar with a screen number and related time stamp.
The replay bar represents all 100 stored screens in memory. The
icon
represents the picture being displayed on the screen. If the bar is partly white,
the memory is not completely filled with 100 screens.
52 THS3000 Series Oscilloscopes User Manual
 Loading...