List of Figures
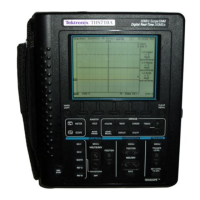
Figure 1: Instrument front panel .................................................................................. 3
Figure 2: Rising edge of square wave........................................................................... 12
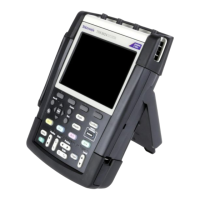
Figure 3: Tilt stand and location of Kensington® Lock....................................................... 13
Figure 4: How to use the hanging hook handle ................................................................ 14
Figure 5: How to use the hanging strap handle ................................................................ 15
Figure 6: Top panel input connectors ........................................................................... 17
Figure 7: Isolated input architecture............................................................................. 18
Figure 8: Common-reference input architecture ............................................................... 19
Figure 9: Parasitic capacitance between probes, instrument, and environment .. .......................... 21
Figure 10: Parasitic capacitance between analog and digital reference ..................................... 22
Figure 11: Correct connection of reference leads.............................................................. 22
Figure 12: Wrong connection of reference leads............................................................... 23
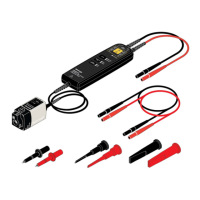
Figure 13: Making voltage probe connections on four channels. ............................................ 24
Figure 14: Voltage probe connection using a ground spring.................................................. 25
Figure 15: Connections using hook tips and alligator clip grounding ................................... .... 26
Figure 16: Probe tip ground ring................................................................................. 27
Figure 17: Display with Autoset................................................................................. 30
Figure 18: Display with AutoRange™.......................................................................... 31
Figure 19: Hz and V peak-peak as measurements ............................................................. 33
Figure 20: Frozen (stopped) display............................................................................. 34
Figure 21: Live (running) display ............................................................................... 35
Figure 22: Using persistence to observe dynamic signals .................................................... 37
Figure 23: FFT measurement .................................................................................... 43
Figure 24: RECORDER REPLAY main menu ............................................ .............. ...... 47
Figure 25: TrendPlot™ measurement........................................................................... 48
Figure 26: Recording waveforms using Scope Roll Mode ................................................... 49
Figure 27: Zooming in on a Waveform ......................................................................... 54
Figure 28: Voltage measurement with horizontal cursors..................................................... 55
Figure 29: Time measurement with vertical cursors........................................................... 57
Figure 30: Risetime measurement using cursors............................................................... 59
Figure 31: Screen with all trigger information ................................................................. 63
Figure 32: Trigger delay or pretrigger view .................................................................... 64
Figure 33: Making a single shot measurement................................................................. 67
Figure 34: N-Event triggering.................................................................................... 68
Figure 35: Trigger on NTSC video signal field 1 .............................................................. 69
Figure 36: Pulse width triggering................................................................................ 70
Figure 37: Input voltage versus frequency ..................................................................... 94
Figure 38: Maximum voltage between oscilloscope references, and between oscilloscope references and
earth ground ................................................................................................... 94
THS3000 Series Oscilloscopes User Manual iii
 Loading...