110 Using Data & Statistics
Actions Tool menu
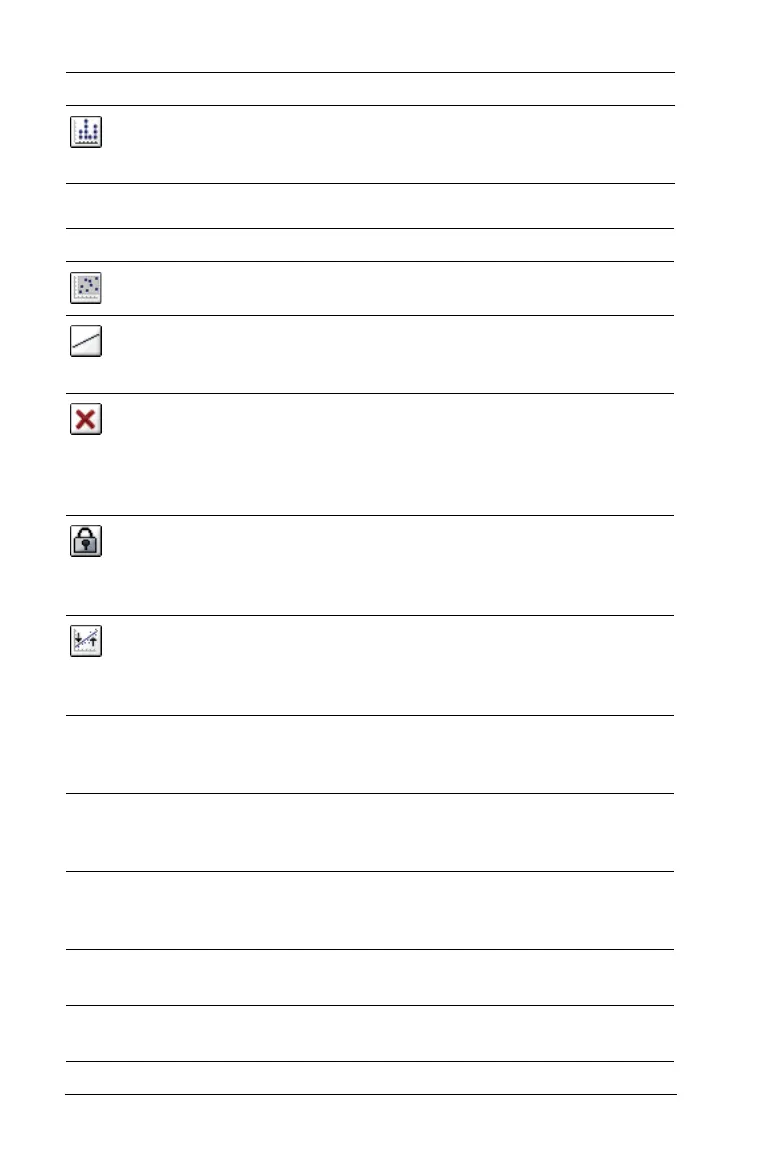
Remove Y Variable Toggles the display of the variable
assigned to the vertical axis without
changing the horizontal axis.
Tool name Tool function
Select all Points Selects all points in the work area.
Add Movable Line Adds a line you can position and
reposition in the work area. This can be
used for manual fit.
Remove Selected Removes the selected object. Changes to
Remove Movable Line, Remove
Regression, Remove Plotted Value,
Remove Plotted Function, depending on
what is selected.
Lock Intercept at
Zero/Unlock Movable
Line Intercept
Locks the intercept of the movable line at
zero.
Note: This tool is only available
when a movable line or regression line is
present in the work area.
Regression The regression tools perform the selected
regression calculation and then plot the
regression model. Regressions are only
available on Scatter plots of X-Y line plots.
Show/Hide Linear
(mx+b)
Calculates and displays the linear
regression line in the format, mx+b, for
the plotted data.
Show/Hide Linear
(a+bx)
Calculates and displays the linear
regression line in the format, a+bx, for
the plotted data.
Show/Hide Median-
Median
Calculates and displays the Median-
Median regression line for the plotted
data.
Show/Hide Quadratic Calculates and displays the Quadratic
regression model for the plotted data.
Show/Hide Cubic Calculates and displays the Cubic
regression model for the plotted data.
Tool name Tool function

 Loading...


