Using Data & Statistics 111
Show/Hide Quartic Calculates and displays the Quartic
regression model for the plotted data.
Show/Hide Power Calculates and displays the Power
regression model for the plotted data.
Show/Hide Exponential Calculates and displays the Exponential
regression model for the plotted data.
Show/Hide Logarithmic Calculates and displays the Logarithmic
regression model for the plotted data.
Show/Hide Sinusoidal Calculates and displays the Sinusoidal
regression model for the plotted data.
Show/Hide Logistic
(d=0)
Calculates and displays the Logistic
regression model where D=0, for the
plotted data.
Show/Hide Logistic
(dƒ0)
Calculates and displays the Logistic
regression model where Dƒ0, for the
plotted data.
Show/Hide Residual
Squares
Displays the squares of residuals.
Note:
This tool is only available when a
regression line or movable line is present
in the work area.
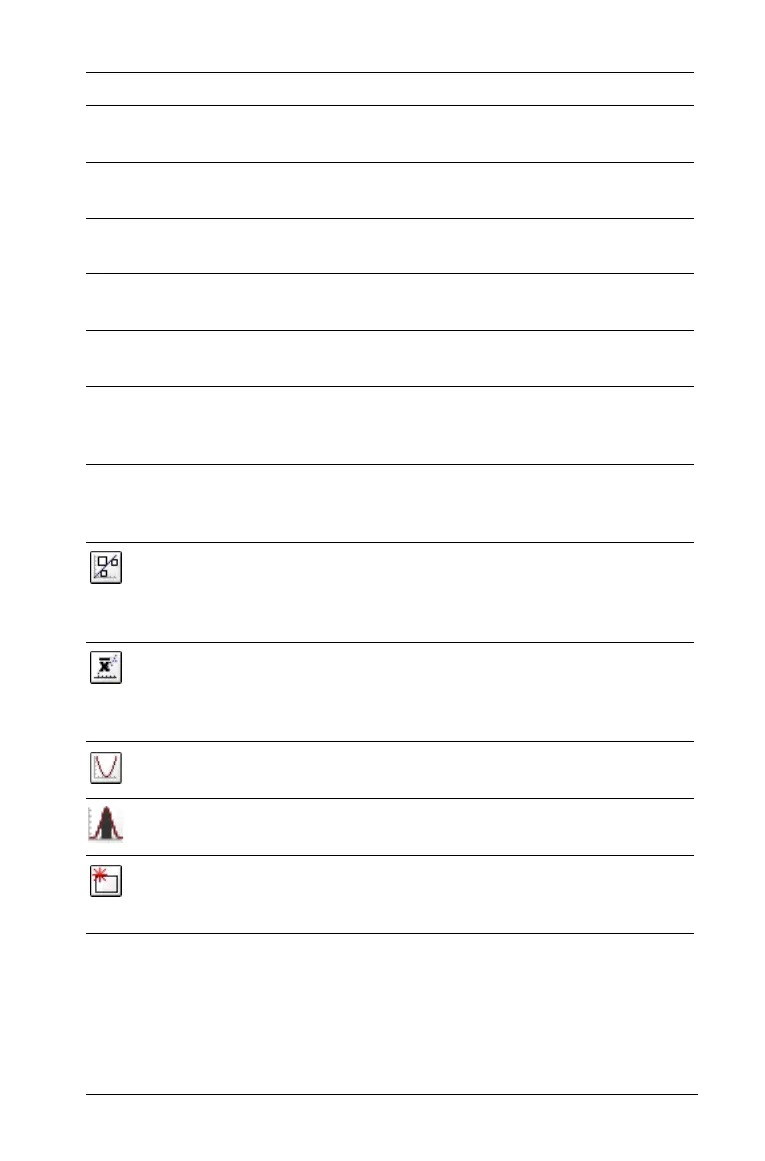
Plot Value Lets you graph a statistical value on the
axis. Examples of values that can be
plotted are mean, median, standard
deviation.
Plot Function Lets you graph a function in the work
area.
Shade Under Function Lets you select and shade a region under a
function or distribution curve.
Start Over Erases the content on the page without
saving any work. This enables you to start
your work again.
Tool name Tool function

 Loading...


