UVITEC – Cambridge
143/225
E
XAMPLE
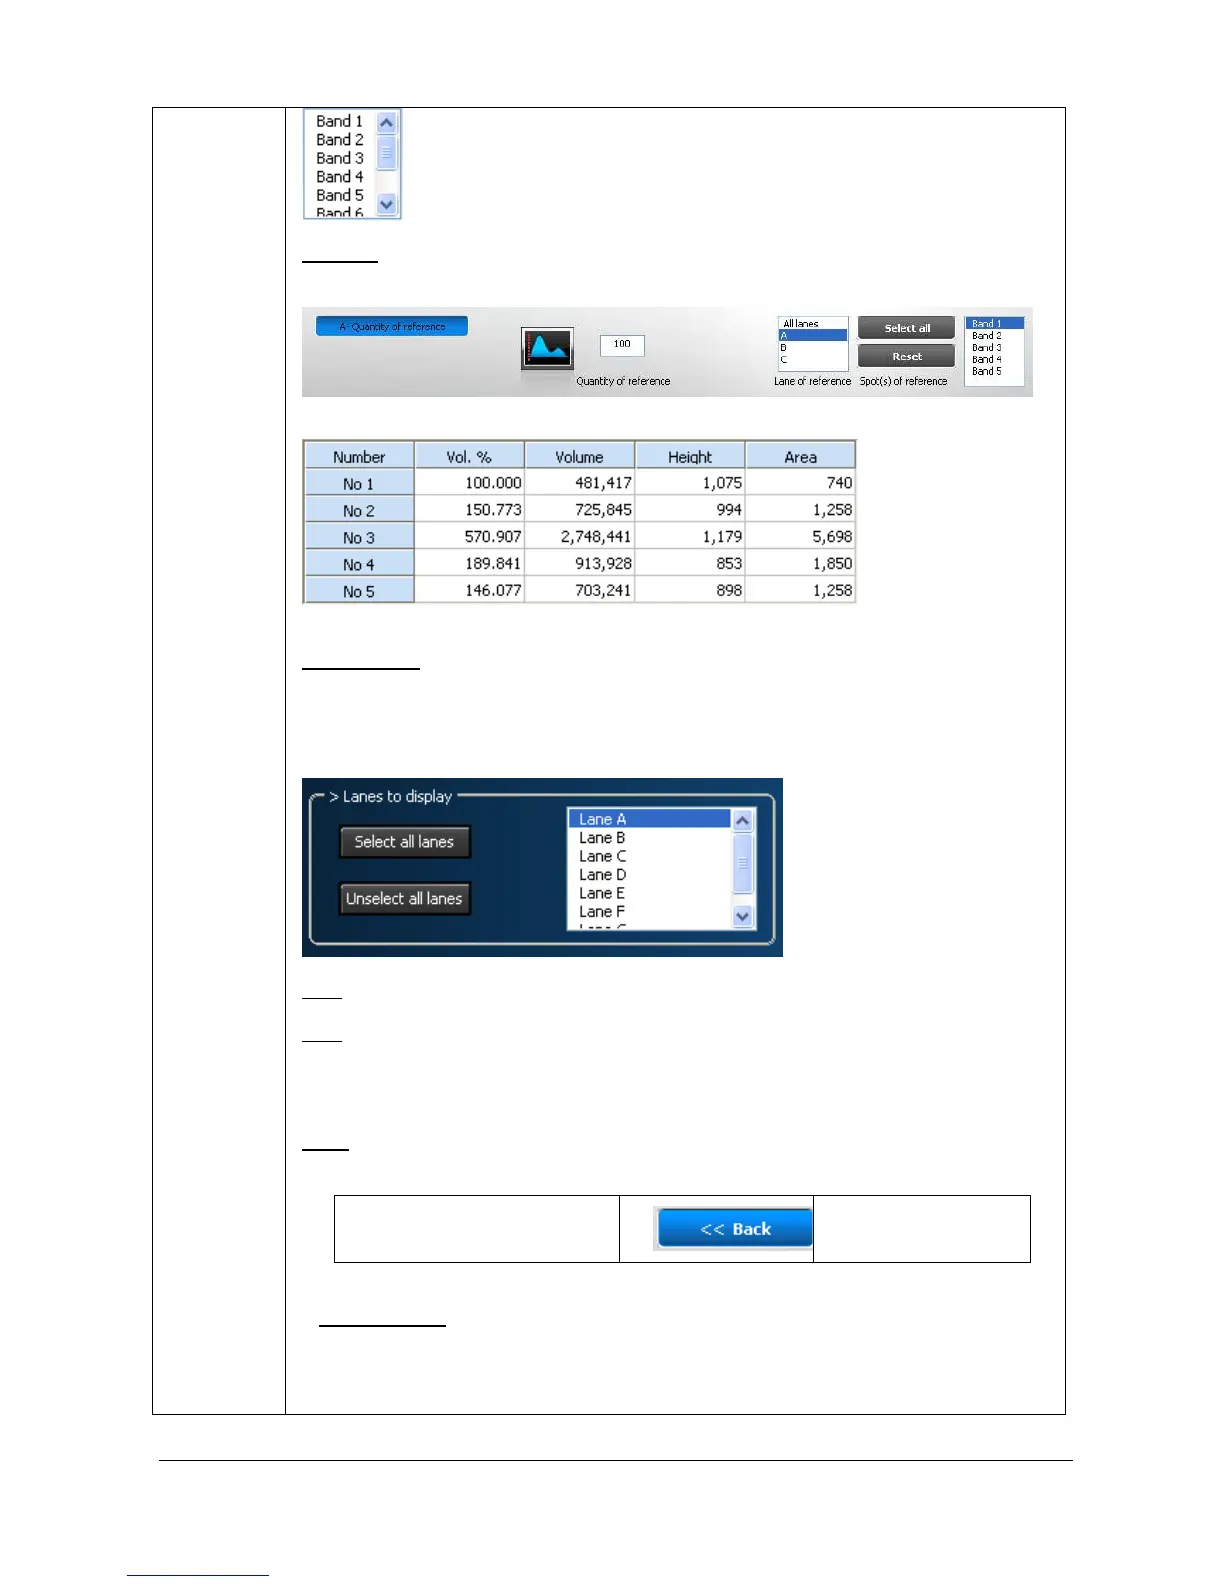
Let’s consider the known concentration is 100% contains in all the spots of lane A. The
settings should then be as follows:
The results table indicates the following for lane 3A:
R
ESULT TABLE
In the result parameter window, you can select the lanes and the values to be displayed
in the results tables:
Concentration
Volume
Note: You can select or unselect the lanes to display in the results table.
Note: To reposition the 1D profile window, position your cursor at the top of the box. The
cursor appearance will change to a multidirectional arrow symbol. You can then drag the
box to a new position.
B
ACK
The “Back” button validates your parameter and opens the following analysis step.
1C – Spot separation 2A – Quantity of
reference
O
PTION FOLDER
The option folder gathers the following functions:
Help