Page 78 of 148 300004969171/B
Using the VH Screen
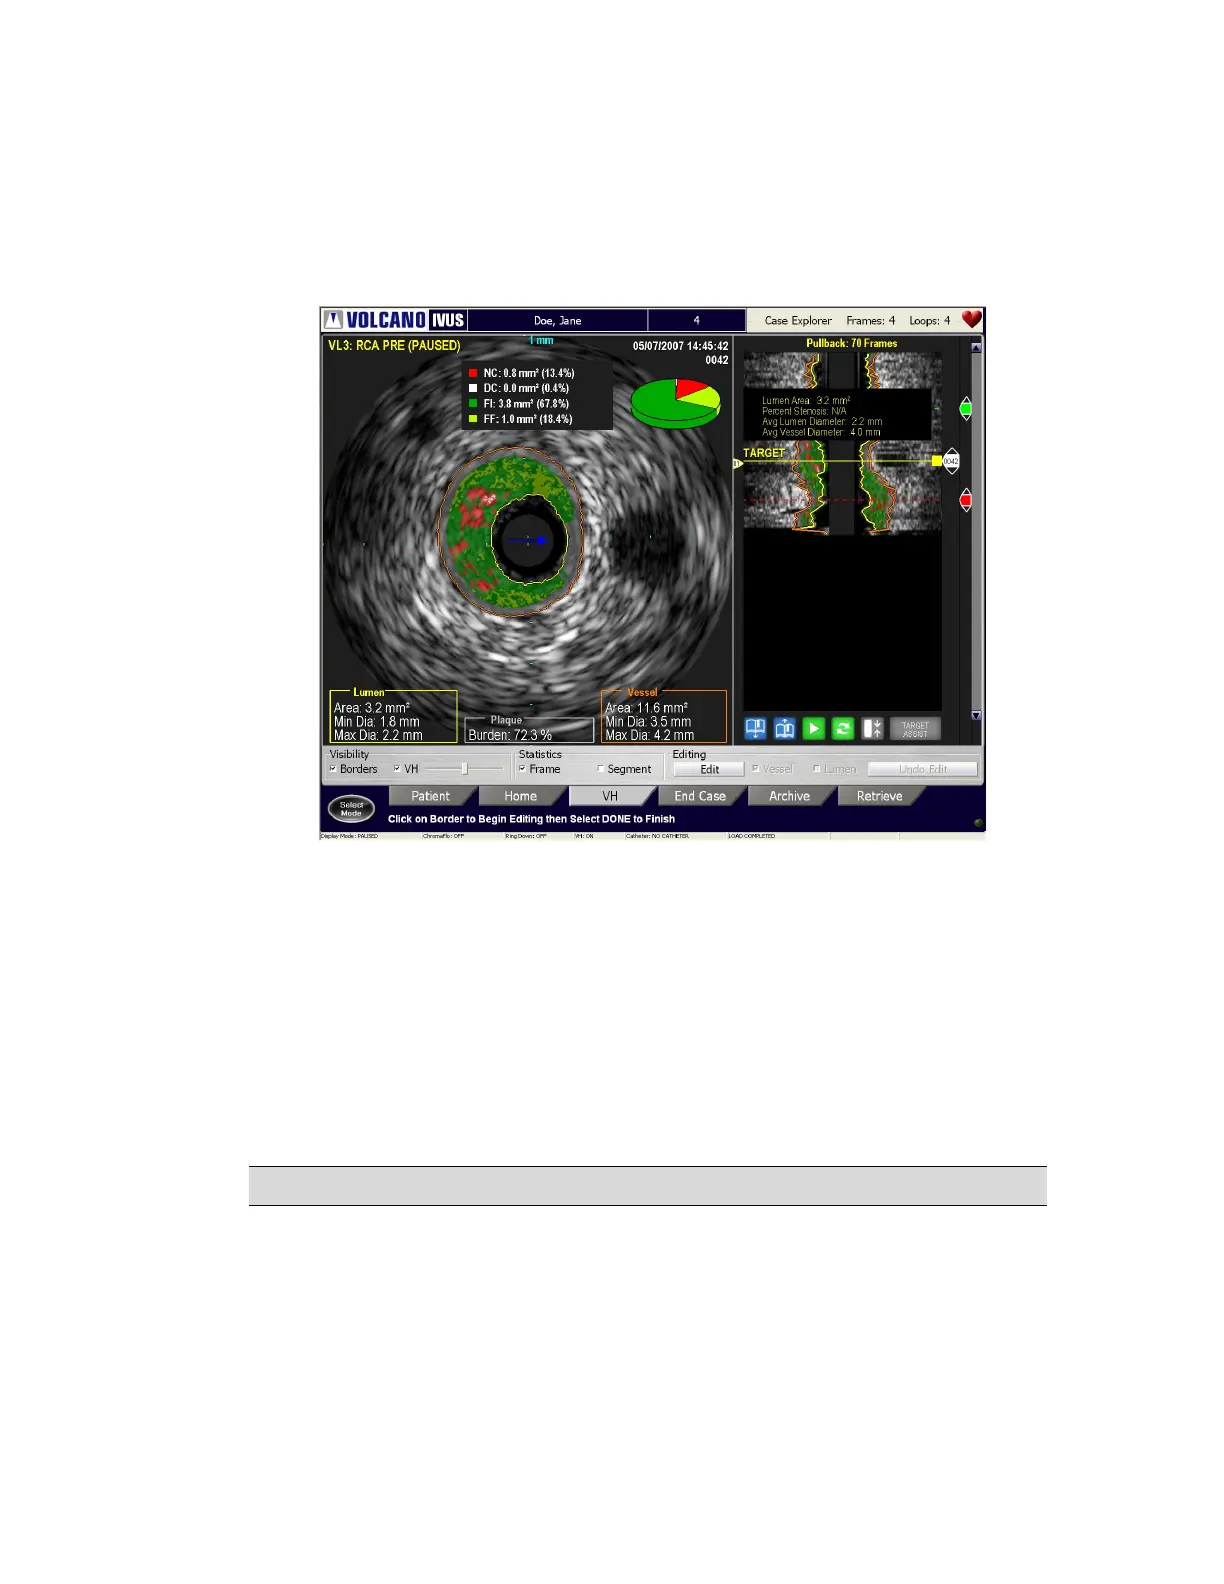
Figure 43: VH Display
The following tasks can be accomplished using the main screen:
Click the Pie chart to display the tissue composition statistics on the screen
Click the Visibility box to display the borders and/or VH IVUS
Click the frame or segment box to display the statistics of your choice
Move the slider bar to increase or decrease the VH transparency over the gray
scale image.
Select the Edit button to edit the borders and select vessel or lumen.
NOTE: Volume and length results are only valid for automated pullbacks.