Making Screw Terminal Connections with External Devices 51
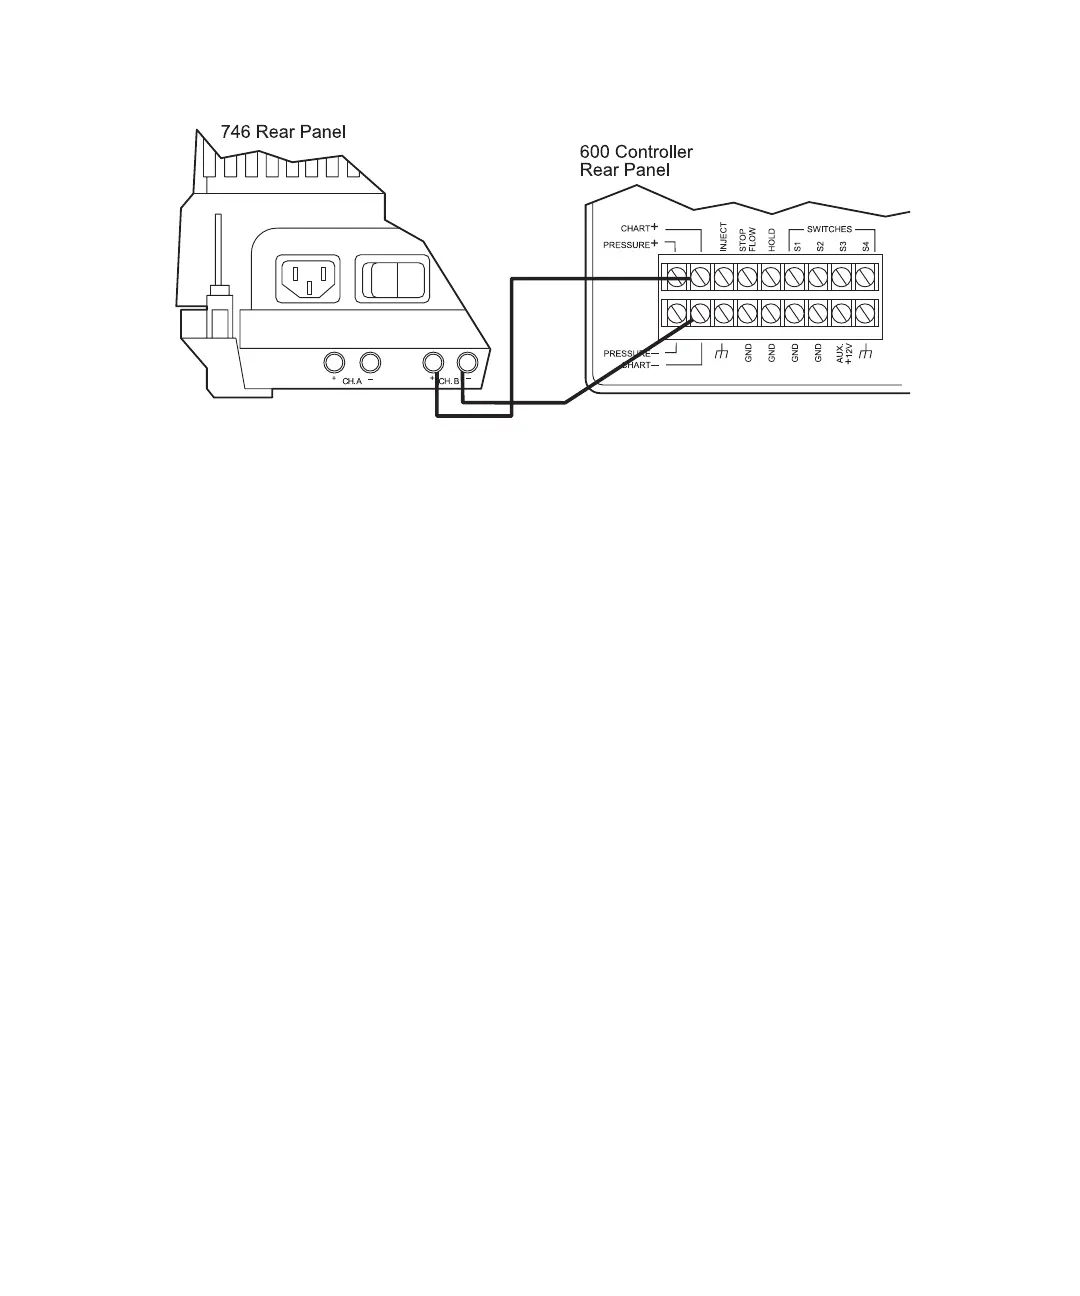
Figure 3-12 Connecting the Waters 746 to the 600 Controller Chart Terminals
3.5.5 Connecting a Chart Recorder
Background
You can use the second pen on your chart recorder to monitor one of the following pump
output signals:
• 600E pump pressure during ramp-up testing (from Pressure terminals)
• Effects that eluents have on pressure during various phases of gradient operation
(from Pressure terminals)
• Eluent composition (A%, B%, C%, or D%), flow rate, or column heater temperature
(from Chart terminals)
Note: When plotting the pump percentage, the output signal reflects the
composition at the proportioning valve. This composition is different from the
composition within the column or at the detector. This difference is the delay caused
by the system volume.
The full-scale range of the Pressure and Chart outputs is 0 to +10 mV. You select the Chart
output function to monitor using the controller Pump Setup screen (as described in the
Waters 600E Multisolvent Delivery System User’s Guide).