CI6X SERIES SPECTROPHOTOMETER
54
3. To exit the graph view, highlight the Graph View icon and tap Select. The screen returns
back to the data display.
Reflectance View
The instrument can display reflectance graphs for the standard and sample at the same time.
Reflectance values (actual or difference) are displayed in 10 nm increments, from 400 to 700
nanometers. Reference data can also be viewed with specular included or excluded.
Measurements can be taken with the reflectance graph displayed in all modes.
NOTE: The reflectance graph is auto scaling and could change when switching between SPIN and
SPEX components. Reflectance must also be selected as an allowed color space in Configuration.
To select reflectance view:
1. From the Measure screen, use the Up or Down navigation buttons to move the highlight focus
to the Color Space icon
.
2. Tap the Right navigation button to access the color space selection area and select
Reflectance.
3. Tap the Left navigation button and select the Measure icon
to view the reflectance graph.
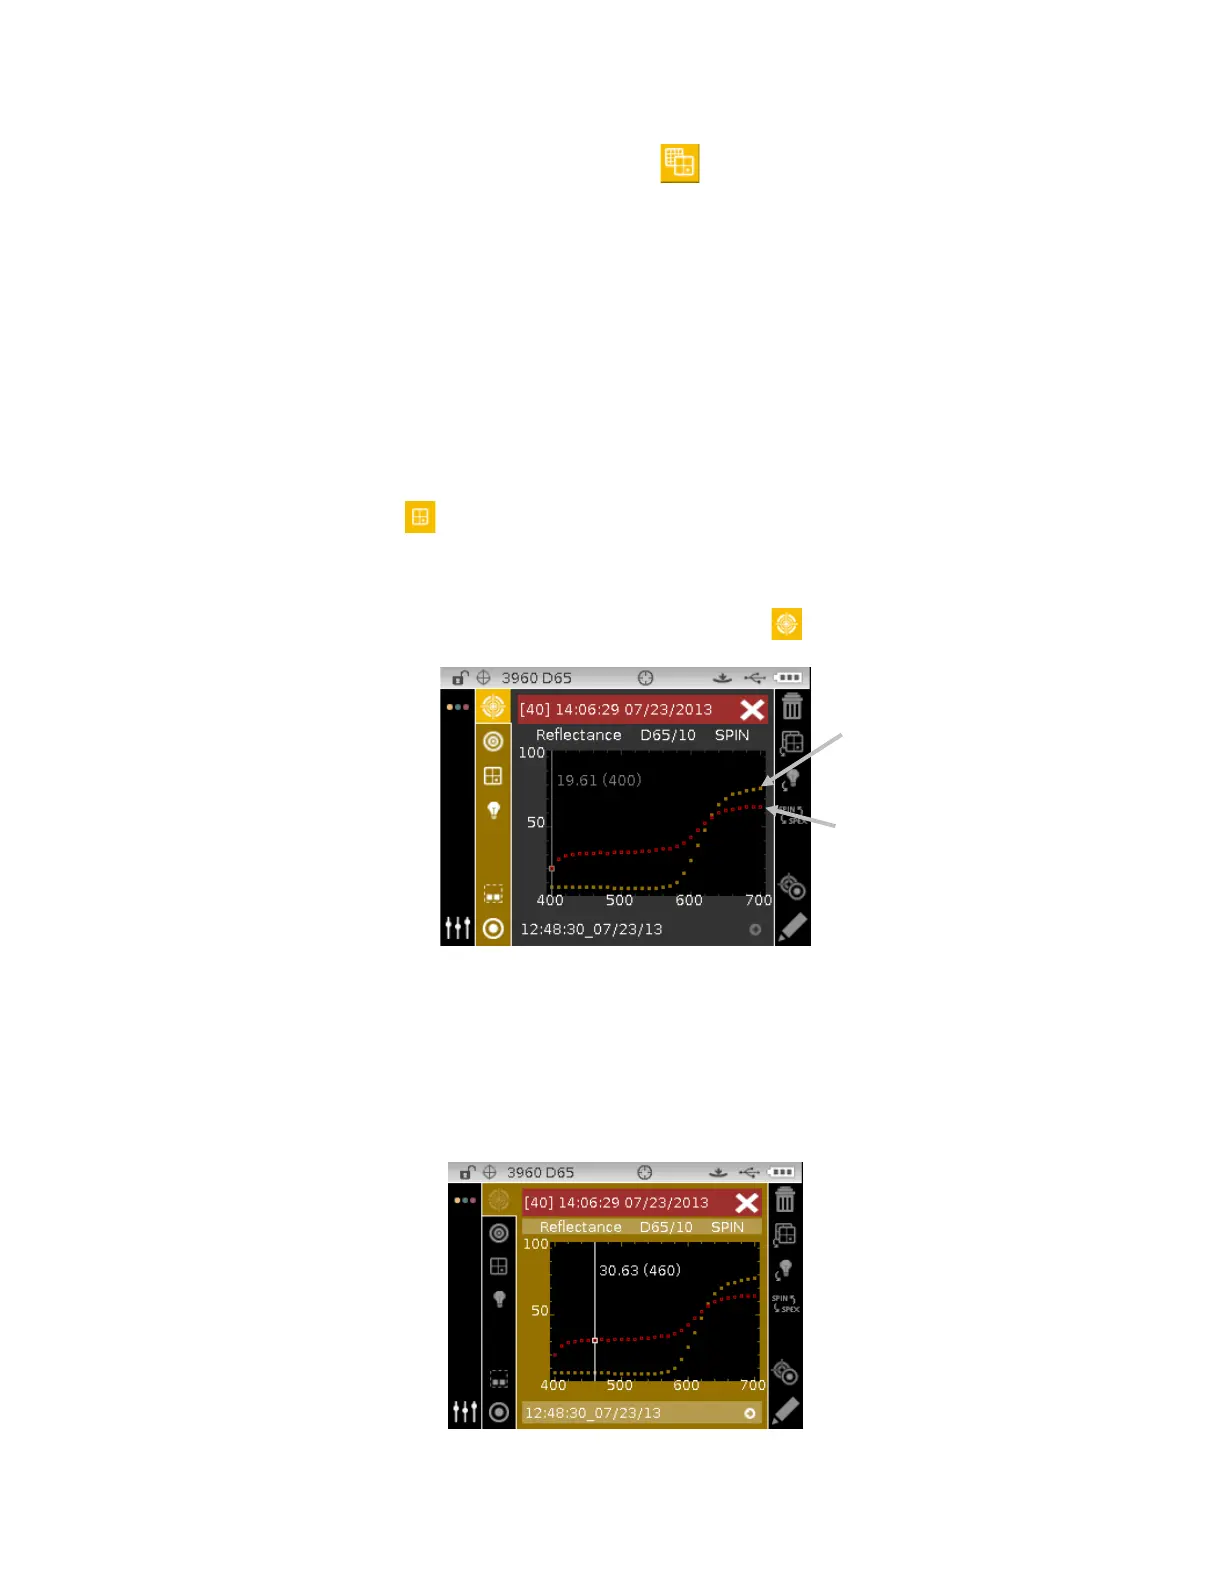
To view individual reflectance points on the standard and sample curve:
1. Tap the Right navigation button to highlight the Content area.
2. Tap the Select button to activate the selection mode. The value and nanometer point turn
white when activated.
3. Use the Left and Right navigation buttons to view values in 10 nm increment.
4. Tap the Up or Down navigation buttons to toggle between the standard and sample curve.
Sample curve (green or red)