27 / 99 www.xovis.com
Note: When the “path” checkbox gets unchecked, the tracks will disappear from the scene
view and be reset (when re-selecting the path live map checkbox, the old paths will not be
included again).
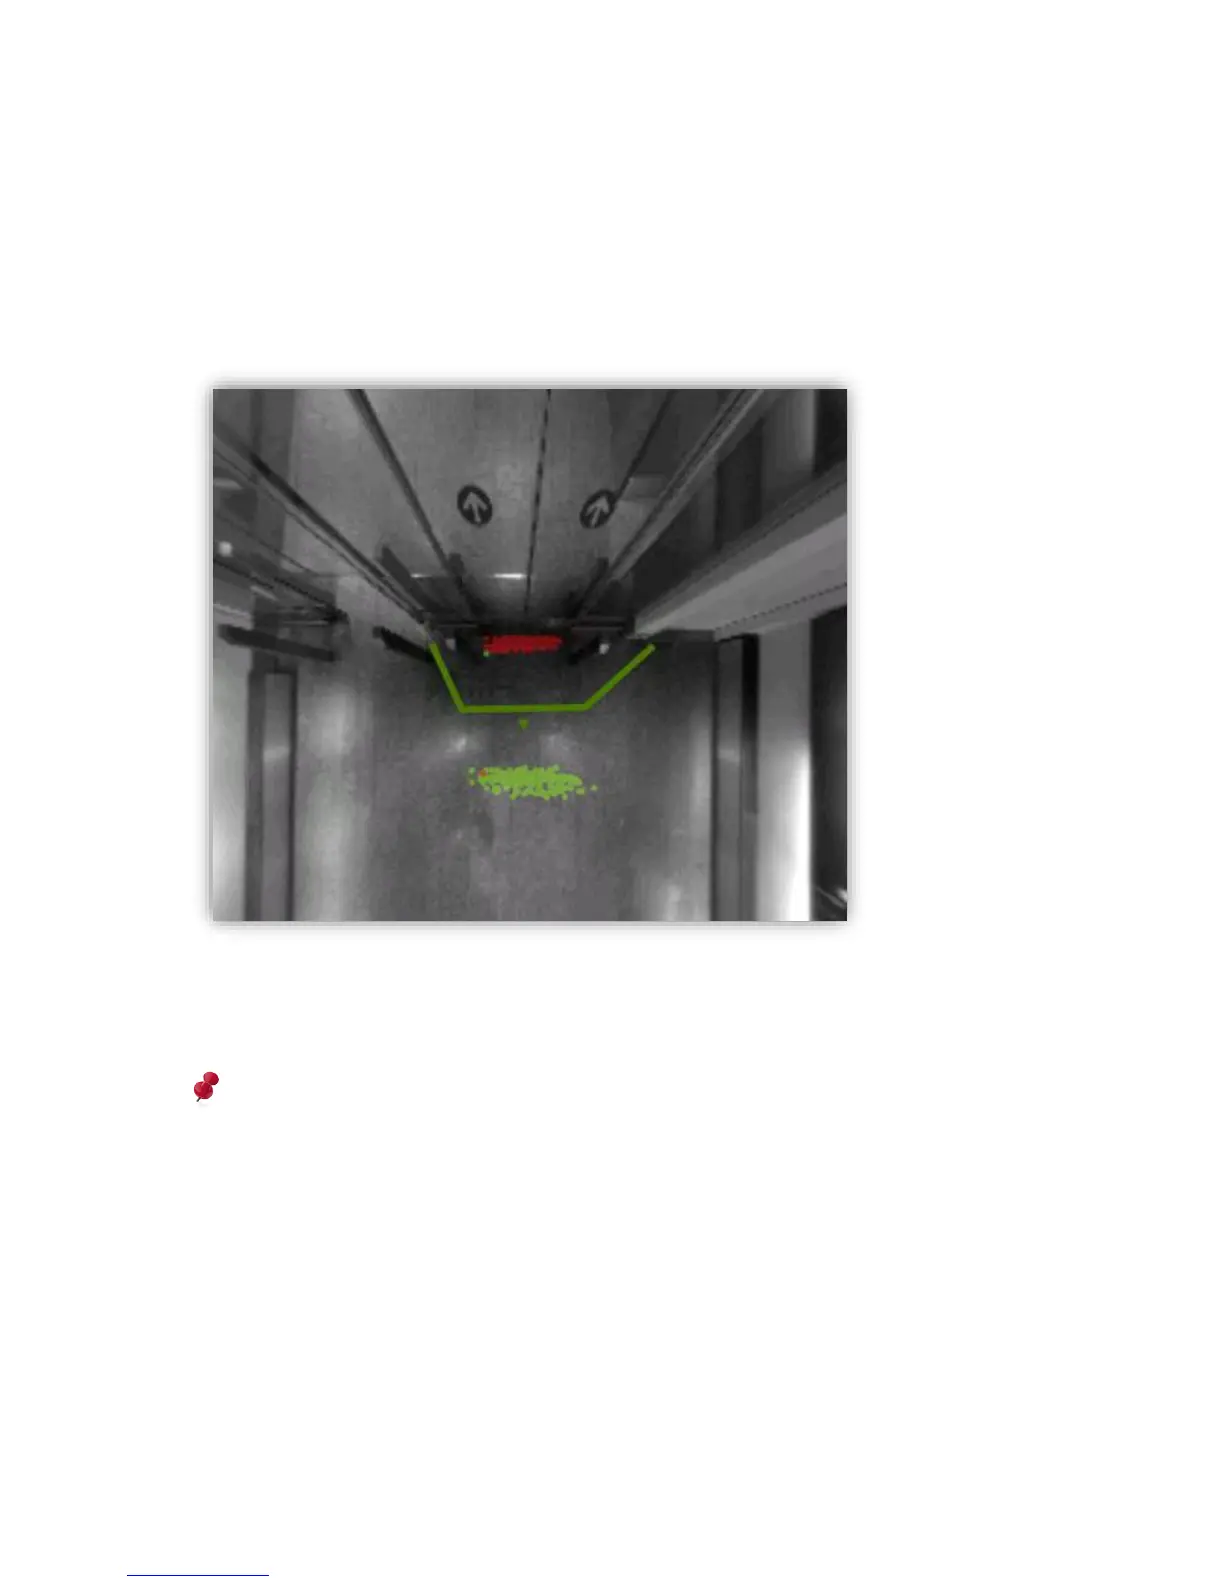
If the “start/stop” checkbox is selected, generation and deletion points of all persons will be
displayed as green and red dots. This allows to analyze, where people actually start to get
tracked and where they disappear again. Using this point map, a count line can be easily
adjusted properly to ensure to not miss any person.
Figure 26: Start/stop map visualizes generation and deletion points of persons
As with the path live map, when the “start/stop” checkbox gets unchecked, the points will
disappear from the scene and be reset.
Please note that all live visualizations are influenced by network bandwidth. As the
visualization are drawn by the client (web-browser) here, it is likely that some frames are
missed when low bandwidth is given. This leads to a visualization not showing the actual
truth, as, for example, start points will be drawn later as they actually occurred (location
will be more towards the inside of the scene).
Whenever using the maps for proper analytics, and especially with low bandwidth, it is
highly recommended to use the “visualization maps” instead, as they are based on
persisted, sensor-stored data. See chapter 3.2.9.2 for more details.