94 / 99 www.xovis.com
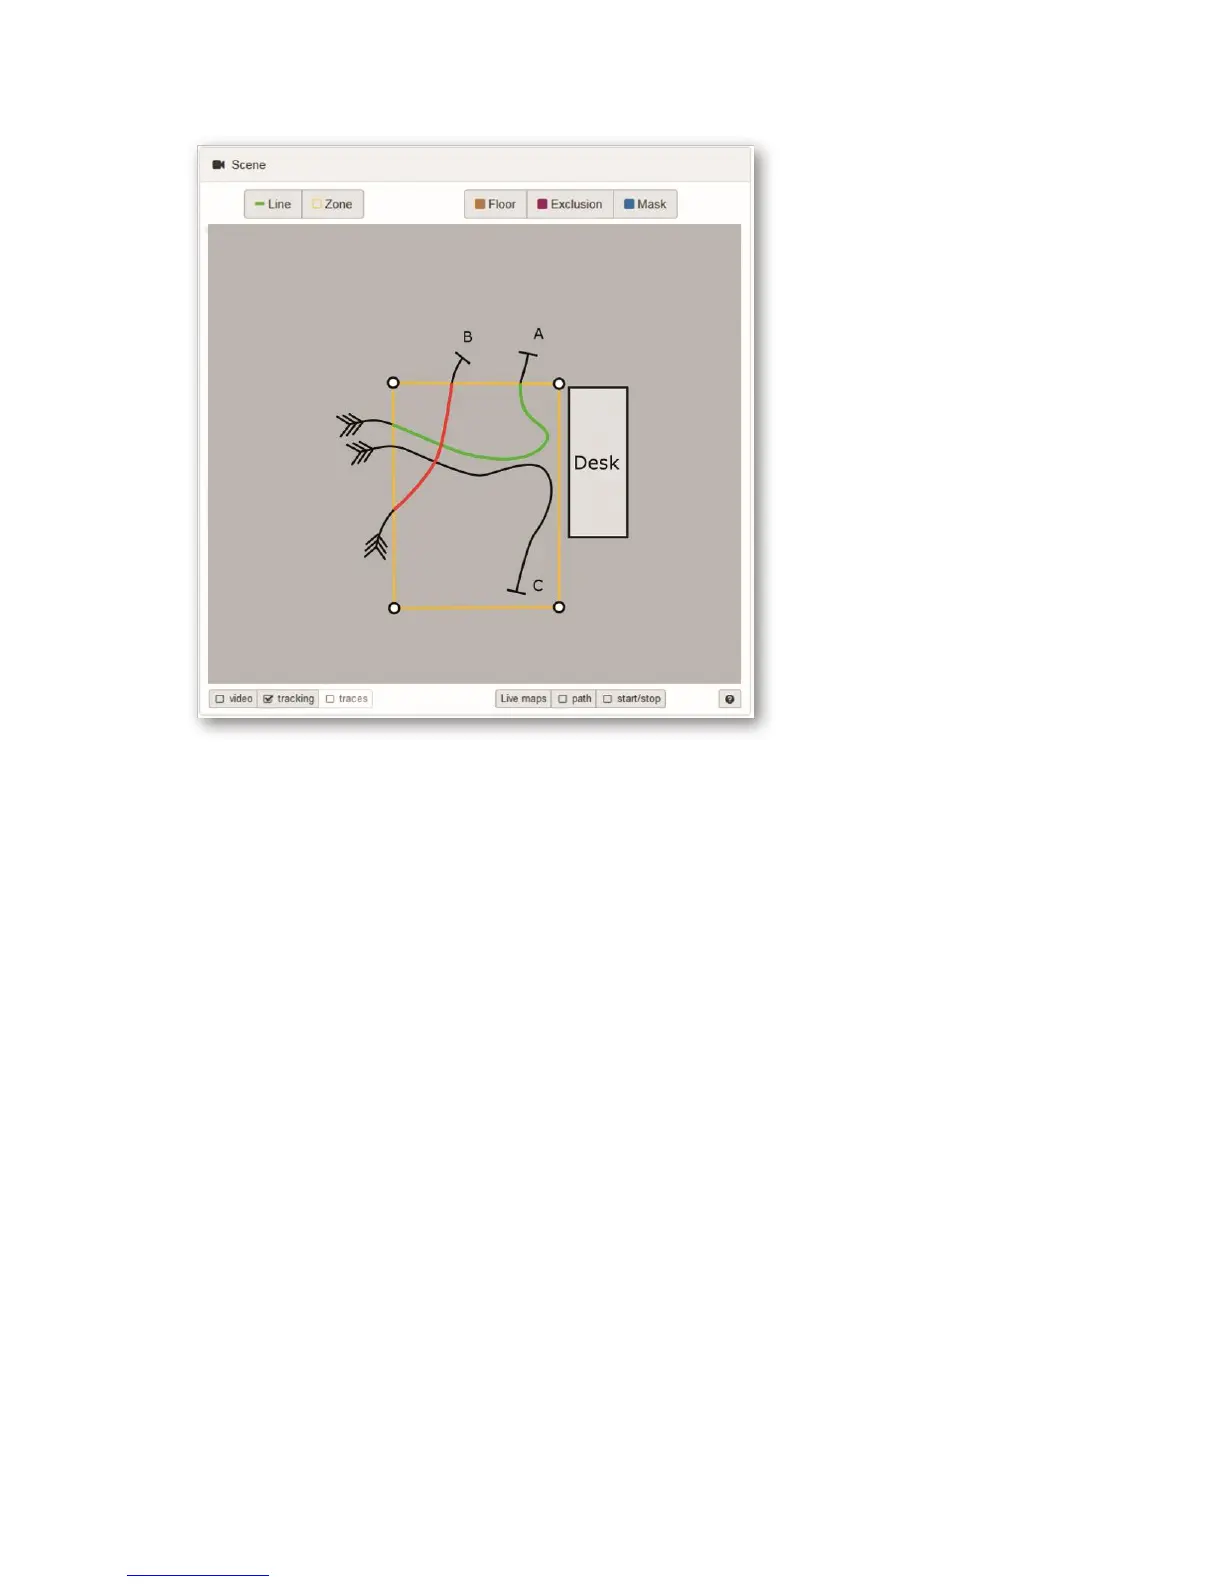
Figure 57: Illustration of different tracks and their influence on dwell time calculation
- Track A enters the dwell zone from the left, walks to the desk (where it is
waiting during the desk process) and then leaves the sensor’s tracking area
towards the top. The track is created AND deleted outside the dwell zone. Its
dwell time is calculated (time between the zone entry and the zone exit, green)
and is then used in the statistical dwell time analysis.
- Track B enters the dwell zone from the left, doesn’t go to the desk, but quickly
moves on and leaves towards the top. As its track is correctly created AND
deleted outside the dwell zone, the dwell time is calculated (time between the
zone entry and the zone exit, red). But as its dwell time was shorter than the
minimal dwell time its dwell time value will not be considered for further
statistical dwell time analysis.
- Track C enters the dwell zone from the left, walks to the desk and leaves the
sensor towards the bottom. Unfortunately, the sensor’s tracking area is not
large enough and the track is deleted before the track leaves the dwell zone.
The dwell time of this track is not calculated, because its deletion point is
inside the dwell zone.
The example of track C shows that special care has to be taken when placing the dwell zone
in order assure correct dwell time analysis, otherwise it could lead to a rather high amount
of not calculated dwell times
As shown in the figures below, the activation of start/stop points can be useful in order to
optimize the dwell zone placement.