48 / 99 www.xovis.com
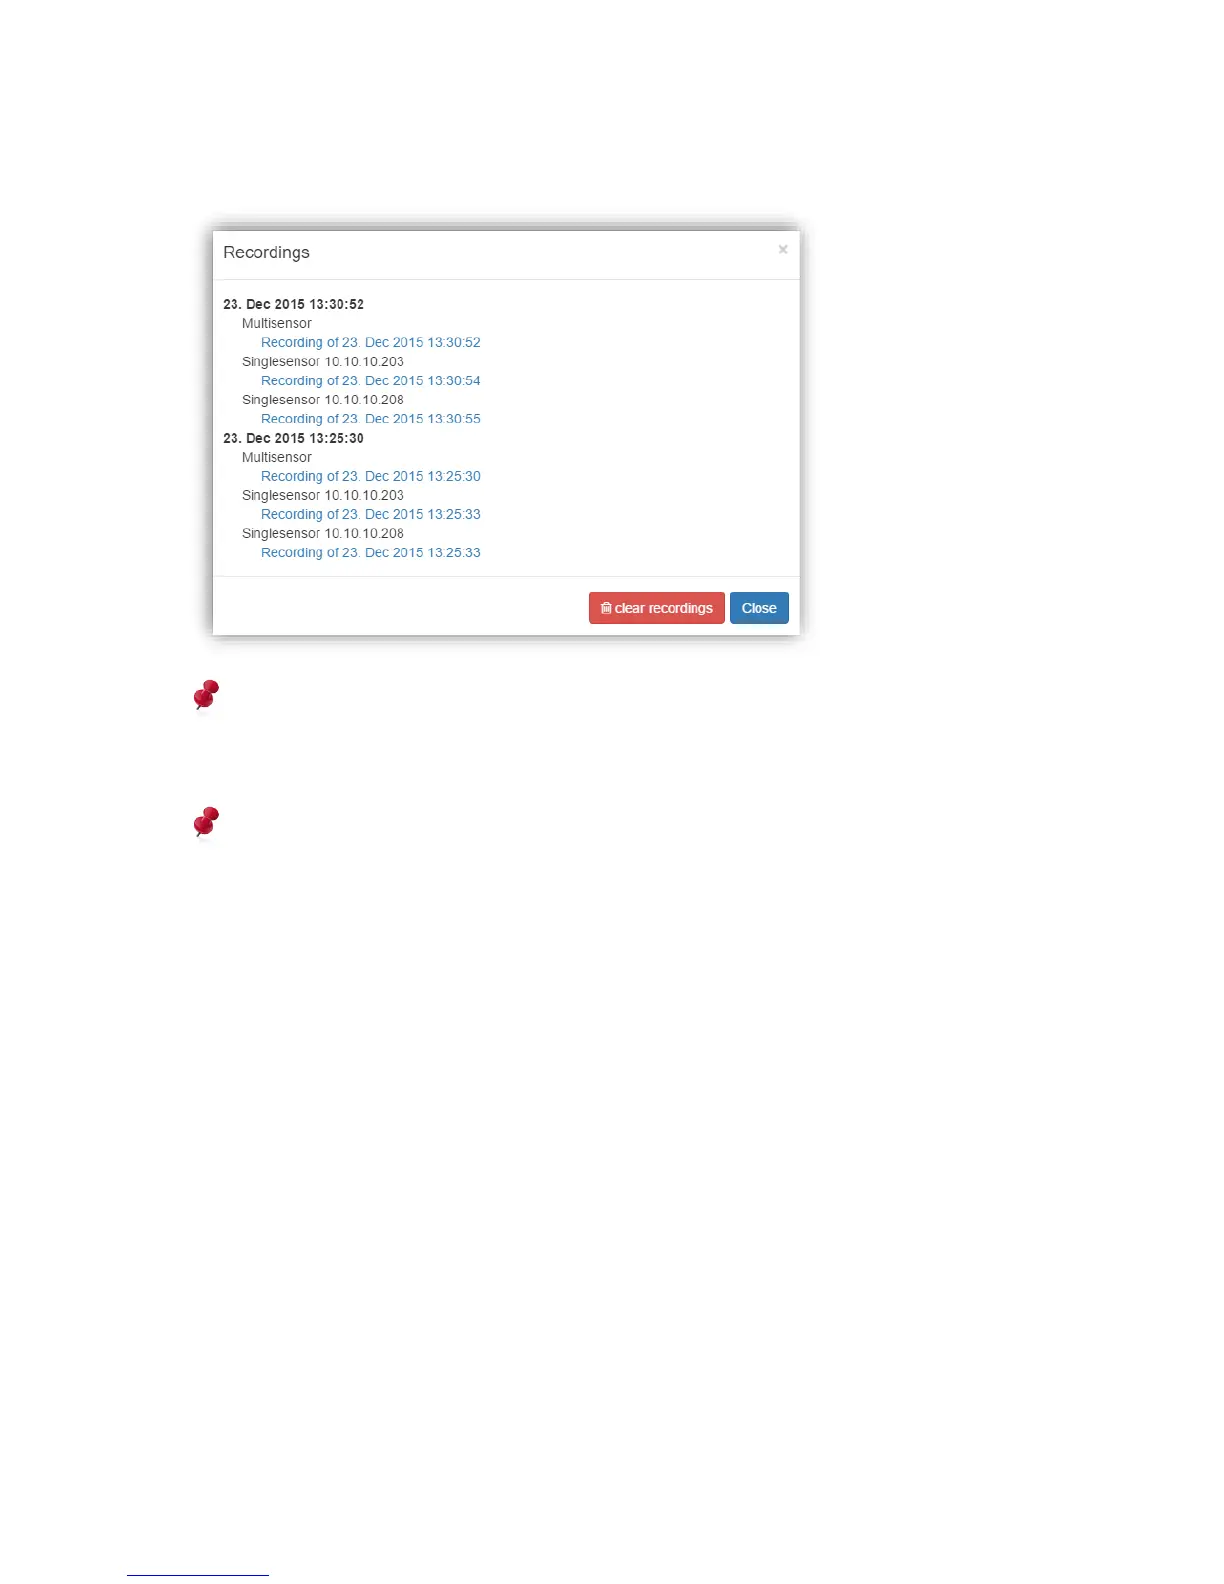
Belonging singlesensor recordings will also be listed in the “show recordings” modal in the
multisensor view and can directly be downloaded here:
Please note, that when using Validation Recording data push (see chapter 3.2.10.4.2) on
the multisensor master sensor, only the recording files from the master device will be
pushed. All participating singlesensor slaves need to also have data push configured if
common provisioning of these files is desired on the remote side.
Please see the Xovis Validation Viewer manual to learn how to evaluate validation
recordings offline.
3.2.9 Analytics View
The analytics view contains two boxes named “Persisted count data” and “Visualization
maps”. With the persisted count data box it’s possible to display custom charts of the
persisted count data. The visualization maps box allows to display the start/stop, height and
heat map based on persisted data on the sensor.