45 / 99 www.xovis.com
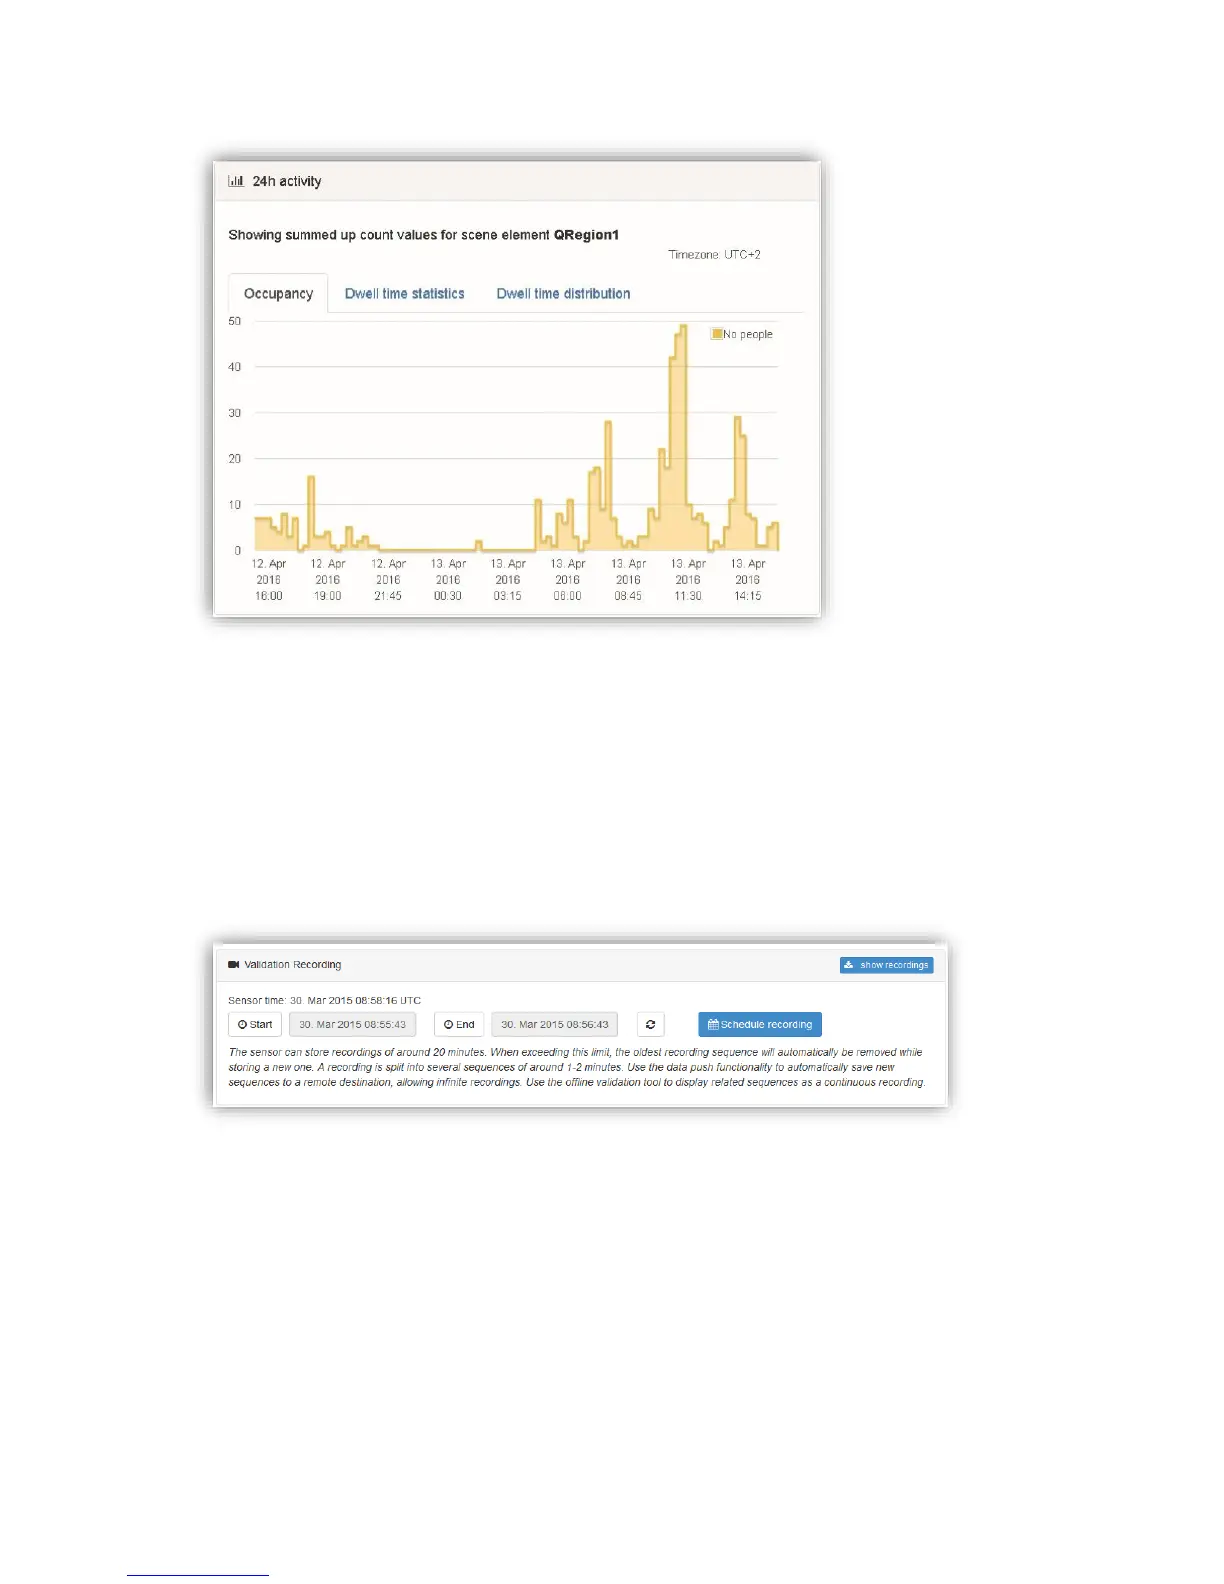
Occupancy and dwell time statistics represent the values in 15 minute bins. Dwell time
distribution shows a histogram of 10 bins with equal size, holding the values of the past 24
hours.
Refer to chapter 3.2.9.1.1 “Count zone charts” for more information on the persisted zone
data.
The chart is automatically updated every minute.
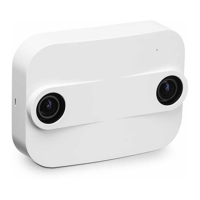
3.2.8.4 Validation Recording
The “Validation Recording” box allows to manage validation recordings of the sensor. A
validation recording contains the scene video, the person tracks, the count item
configuration and all line counting and crossing events. With these information, the sensors
functionality can easily be validated. Xovis provides the “Xovis Validation Viewer” tool to
analyze validation recordings offline.
The recordings are split into several sequences of 5MB. Use the Xovis Validation Viewer to
visualize the sequences belonging together (it can be downloaded from the Xovis Customer
Portal).