109
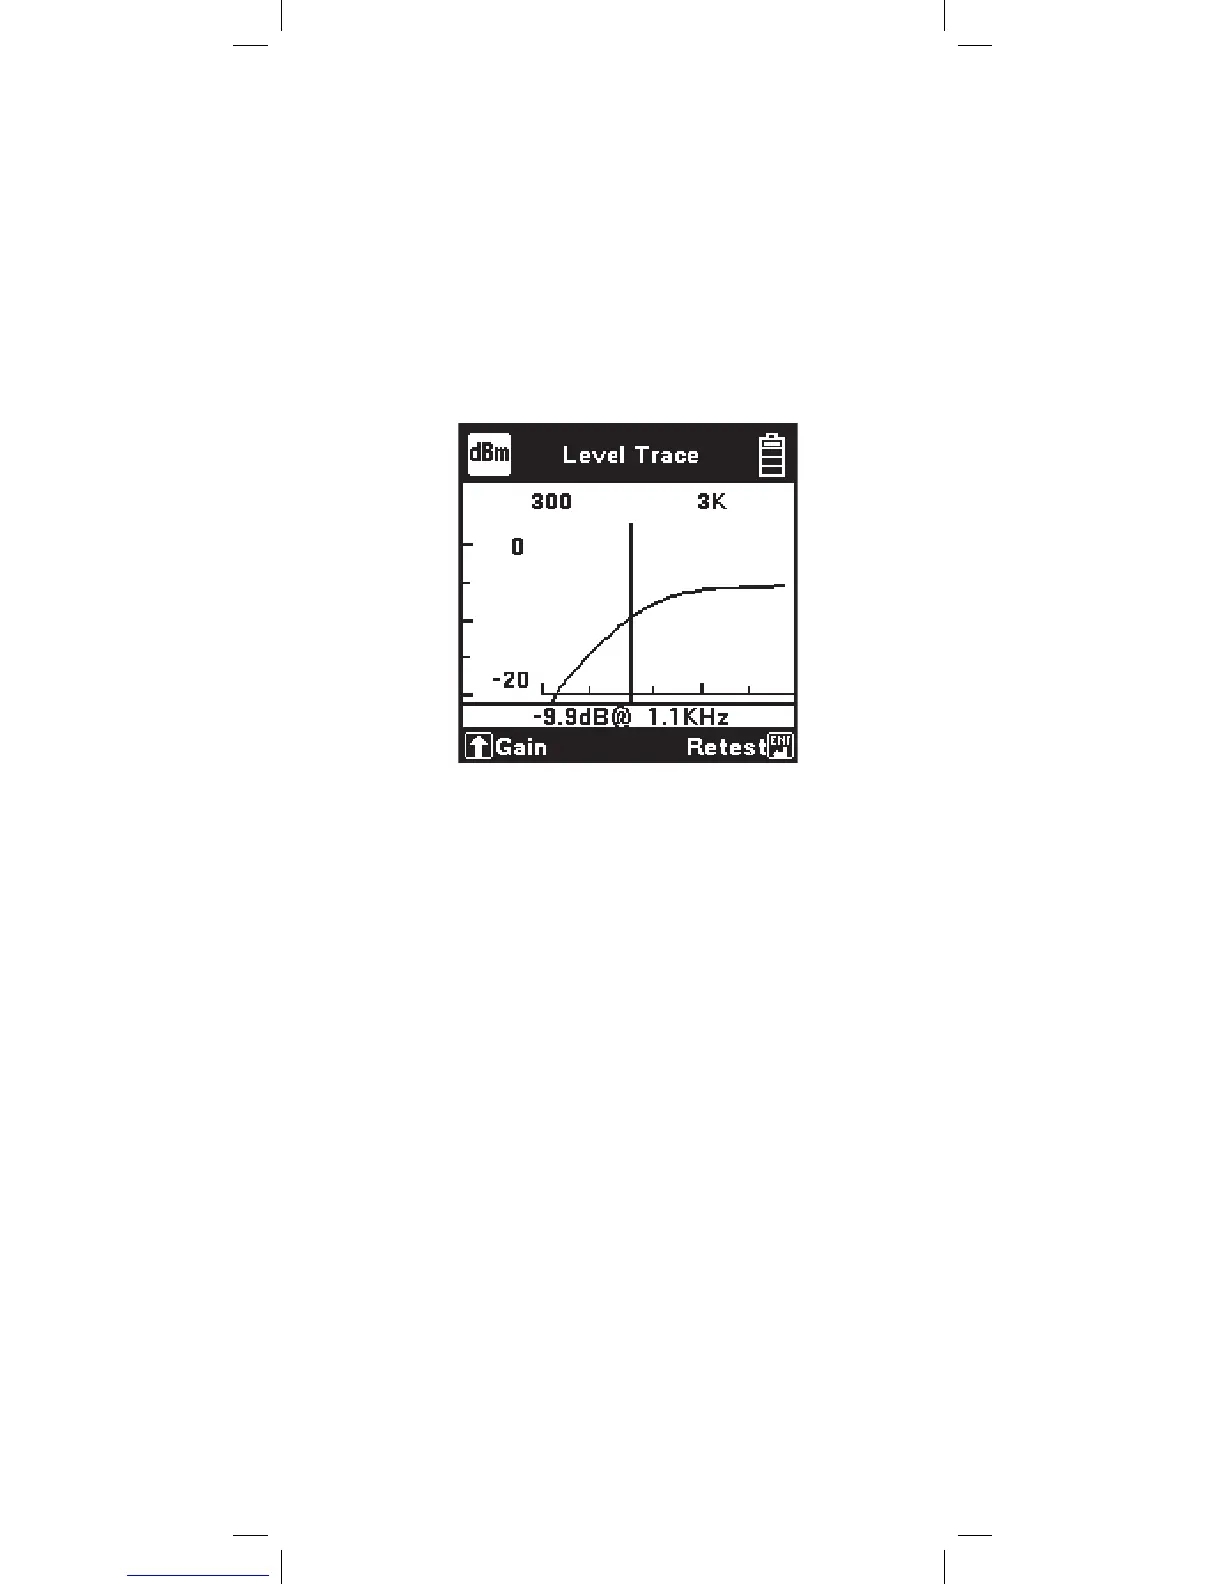
Level Trace
Use this function to measure and display the AC
impedance of an inactive pair as a function of
frequency. This test can be used to analyze a pair
for loading and bridge tap problems. The result is
displayed on a graph with relative impedance level
displayed on the y-axis (in dB) and the frequency on
the x-axis. Attach the red and black test clips to the
pair to be analyzed.
A normal, unloaded line would appear as a slowly
decreasing line. Bulges or dips may indicate the
presence of load coils.
Use the [Right] and [Left] keys to move the cursor
across the graph. As the cursor is moved, a readout
of the signal level and frequency will be displayed
beneath the graph. A value of -3.53 dB corresponds
to an impedance of 600 ohms at that frequency. 0 dB
indicates a short-circuit and a large negative value
corresponds to an open circuit. If part of the graph is
off of the screen (out of view), use the [Down] key
to reduce the gain. Use the [Up] key to increase the
gain. Press the [Enter] key to repeat the test or the
[Return] key to return to the dB menu.