USER MANUAL | ICOS | INSTRUCTIONS | UM/ICOS-EN REV. B.2
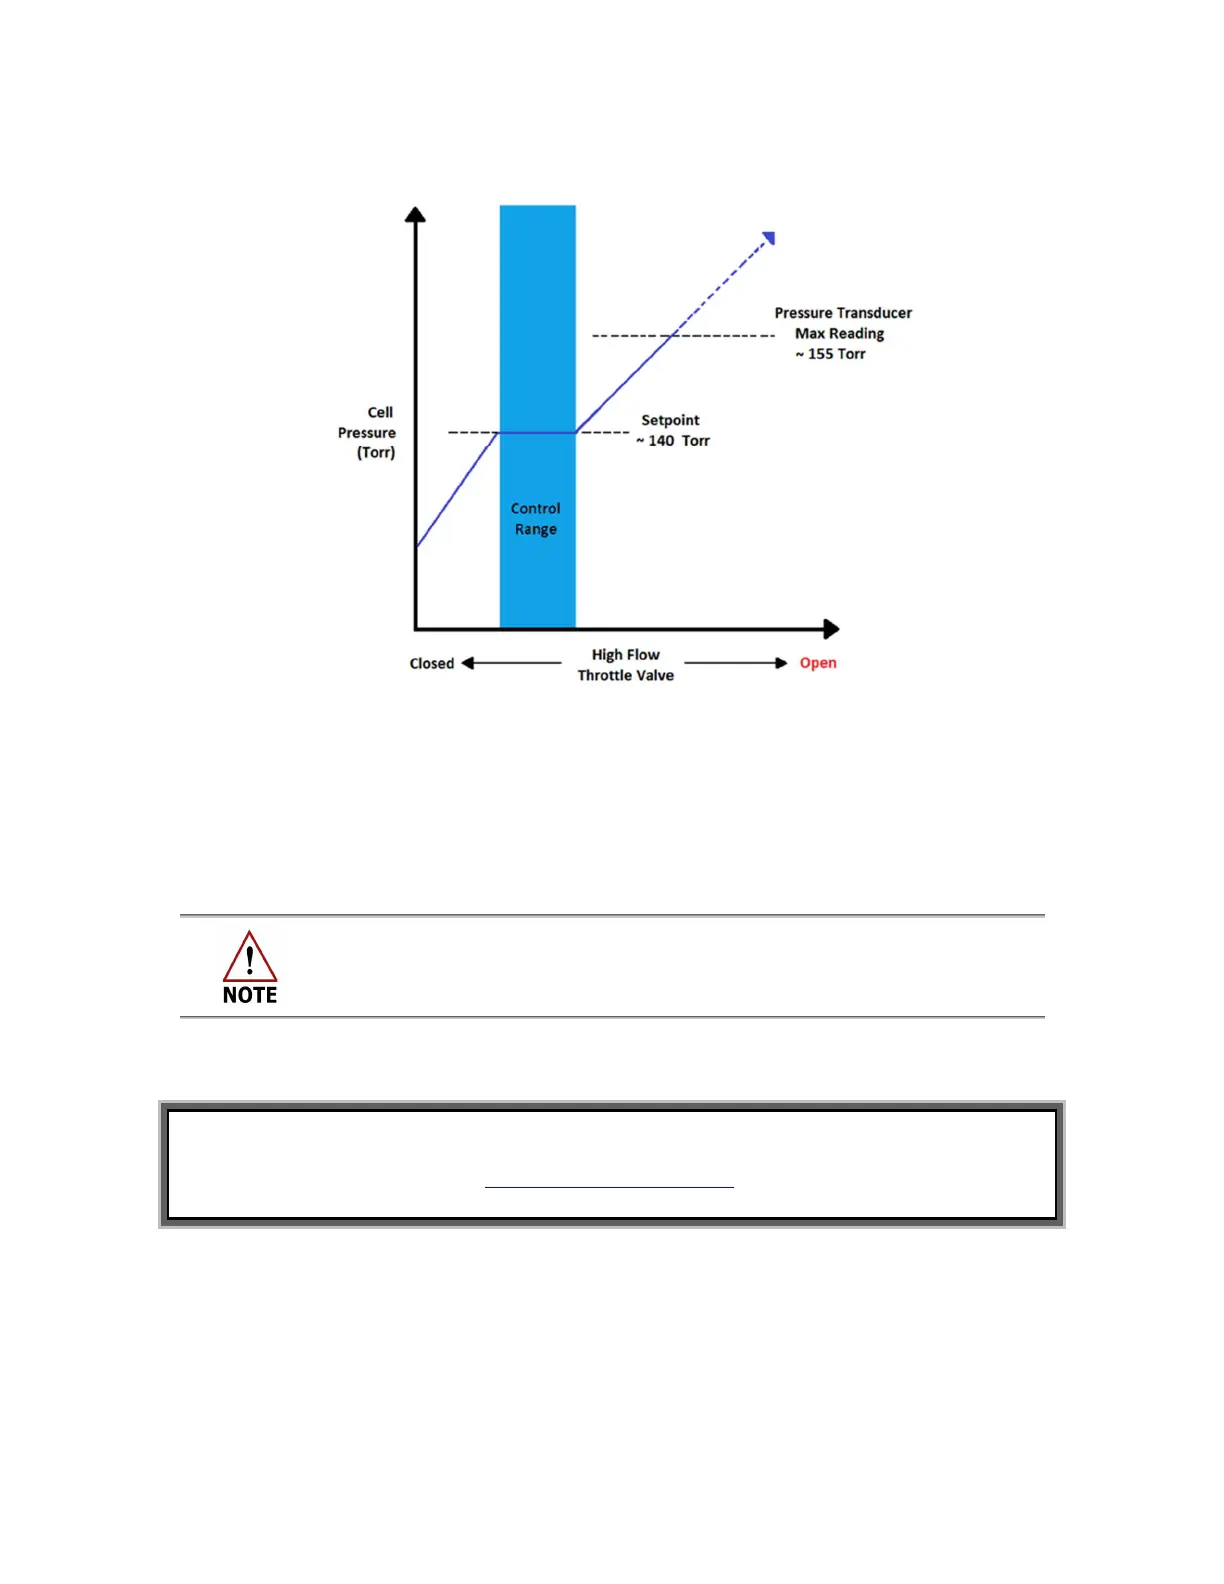
Figure 104 shows a diagram of an analyzer’s control range with the set point at 140 Torr.
Figure 104: Control Range Diagram
8. Verify that the cell pressure is the same in both flow modes (with External Pump
and Internal Pump)
The maximum range and reading display of the pressure transducer is
approximately 155 Torr—any time the cell pressure is above 155 Torr the
display will remain locked at 155 Torr.
To determine if your analyzer is capable of fast-flow mode, contact ABB-LGR at
icos.support@ca.abb.com.

 Loading...