Chapter 3 Timebase Measurements
Analyzing Timebase Measurement Data
Measurements Reference Guide 3-15
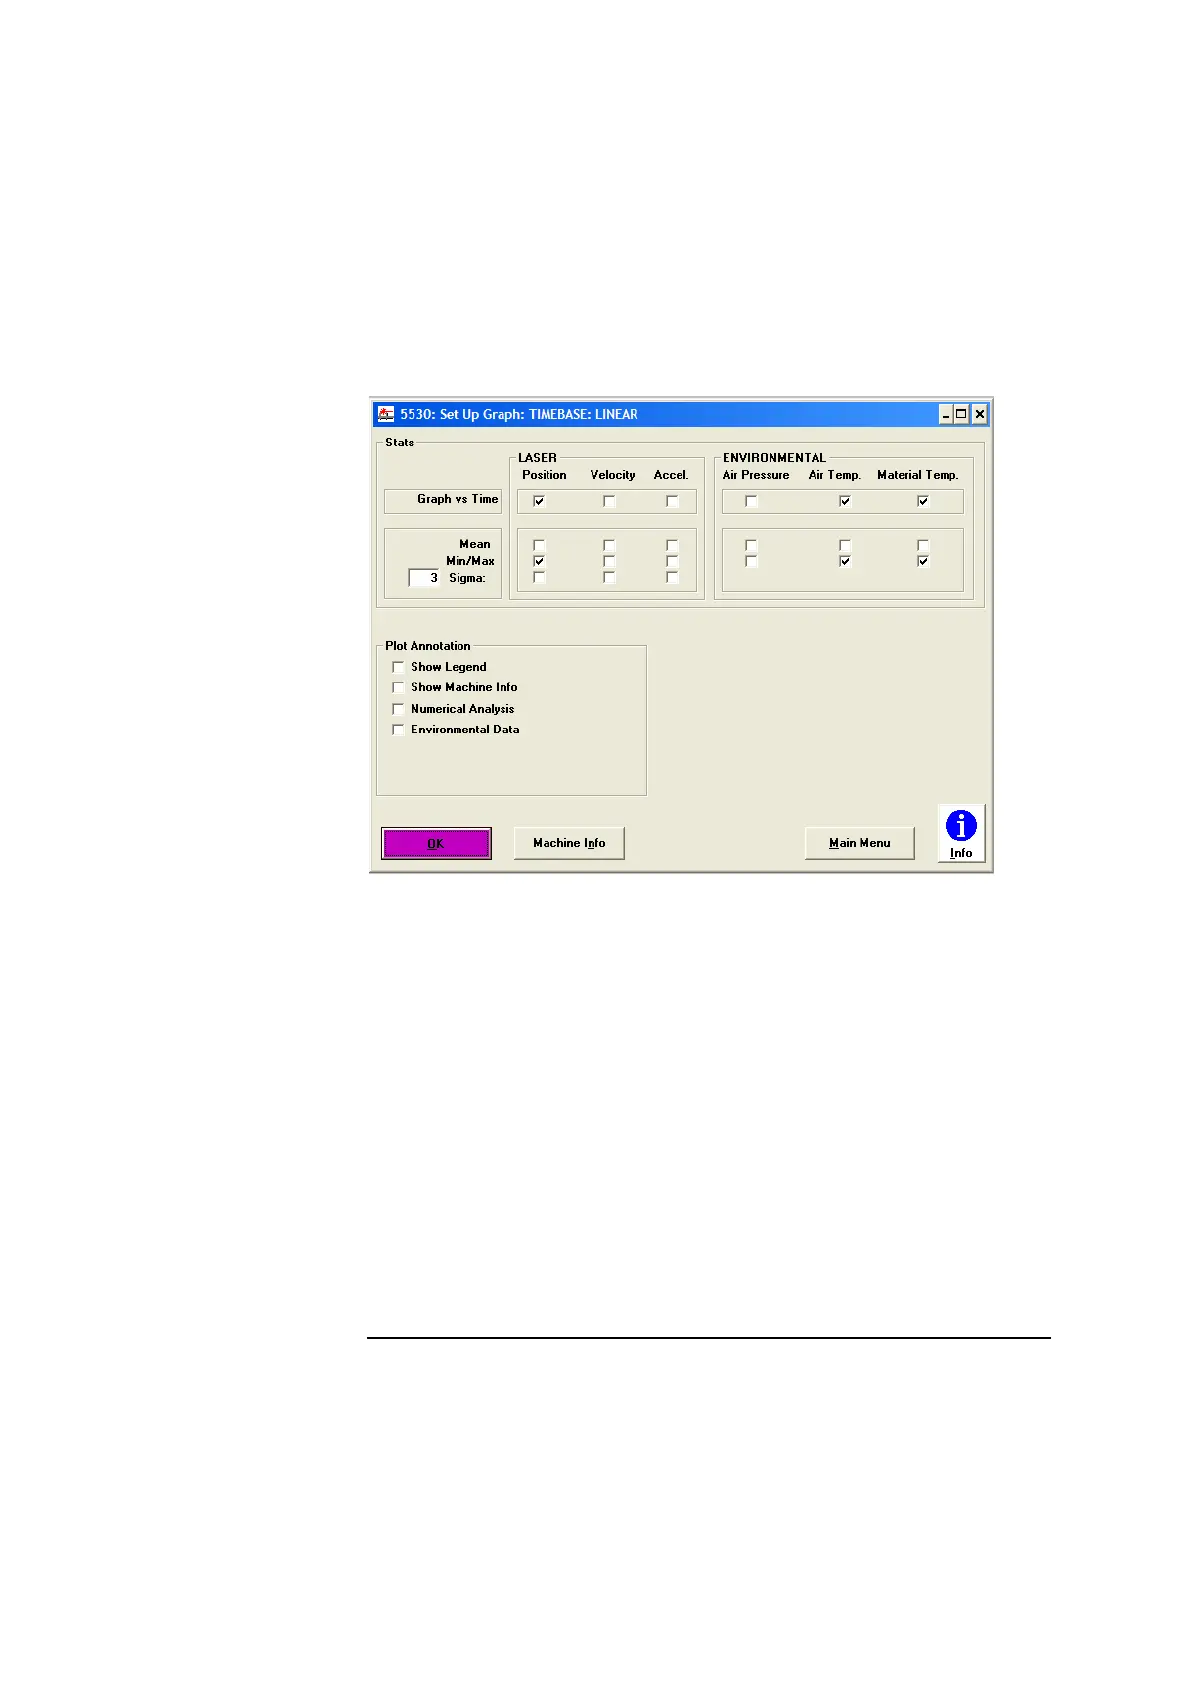
Figure 3-7. Set Up Graph: TIMEBASE screen
2 In the LASER box, select one or more of the choices available.
This tells the system which data to graph. If you want the trace
identification to be included on the graph, select Show Legend in the Plot
Annotation box.
3 In the ENVIRONMENTAL box, select the data to graph.
Environmental data entered manually in the Set Up Laser: TIMEBASE
screen is not graphed or displayed in the Show Data Set: TIMEBASE
screen.
4 In the Stats (Statistics) box, select any additional numeric information
you want for your laser or environmental data.
 Loading...