Chapter 3 Timebase Measurements
Analyzing Timebase Measurement Data
3-16 Measurements Reference Guide
5 In the Plot Annotation box, select any additional information you want to
show on your graph.
Use the online help for more information about these choices.
6 If you want to display or change information about your machine, select
Machine Info.
7 Select Previous to return to the Analyze Data: TIMBEBASE screen.
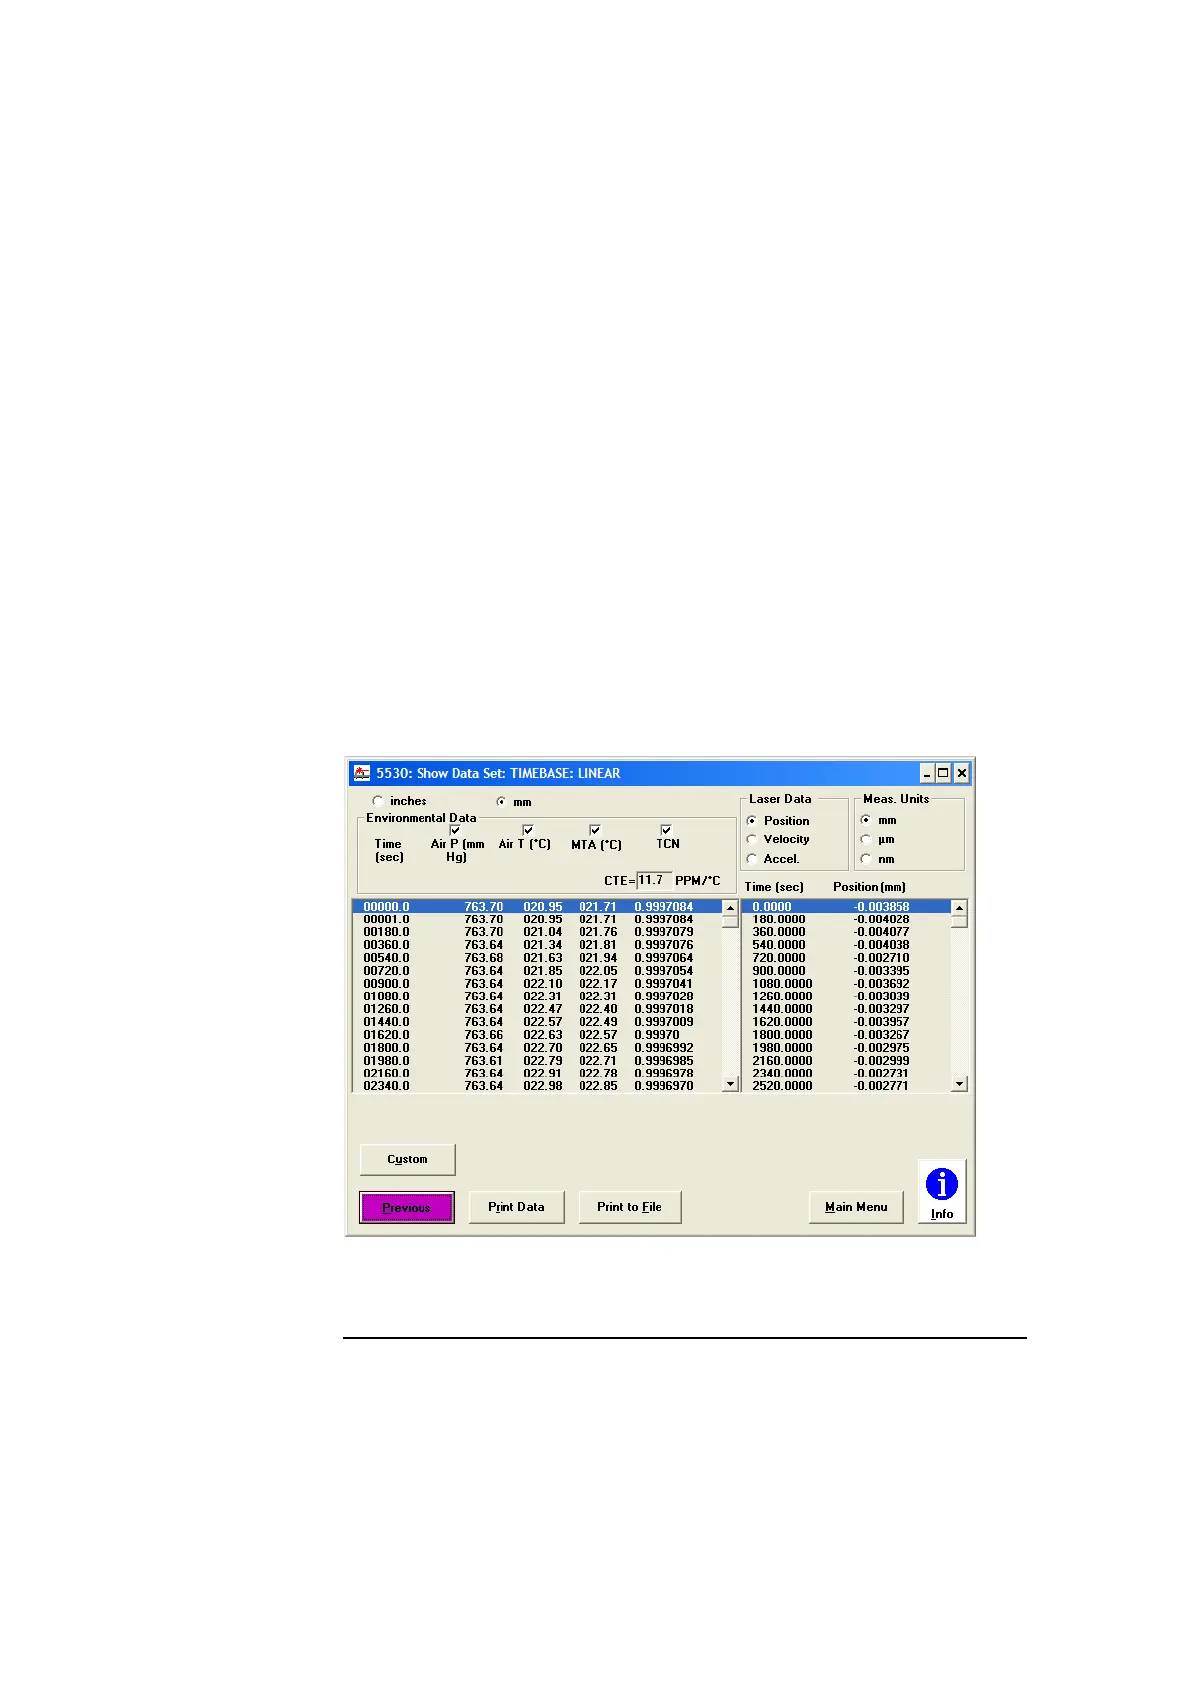
8 To display the timebase measurement data in a table, select Show Data
from the Analyze Data: TIMEBASE screen.
The Show Data Set: TIMEBASE screen is displayed (Figure 3-8).
Figure 3-8. Show Data Set: TIMEBASE screen