APPENDIX C: THE BASICS OF RESISTANCE WELDING
UB25 LINEAR DC RESISTANCE WELDING CONTROL
C-6 990-665
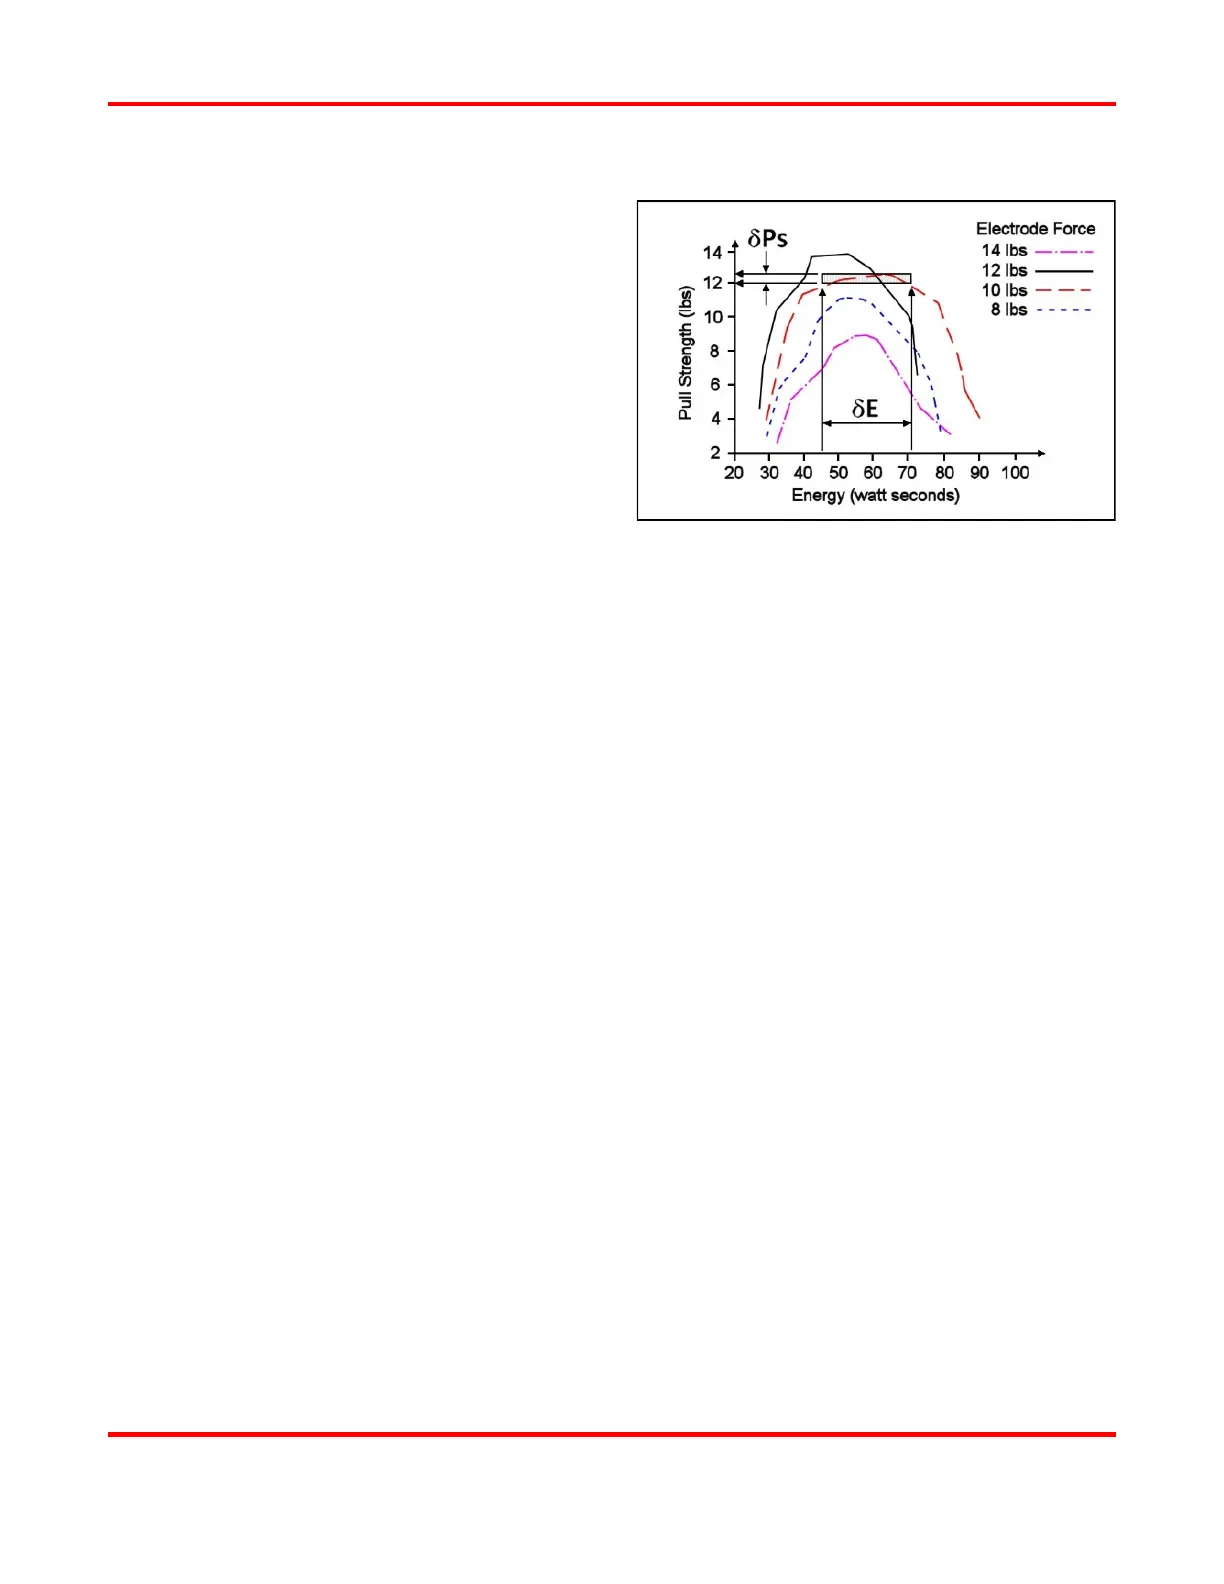
Typical Weld Strength Profile
The picture on the right illustrates a typical weld
strength profile. The 14
lb electrode force curve
shows the highest pull strengths but the lowest
tolerance to changes in weld current, voltage, or
power. The 12
lb electrode force curve shows a
small reduction in pull strength, but considerably
more tolerance to changes in weld energy. Weld heat
will vary as a result of material variations and
electrode wear.
lb electrode fo
rce curve is preferred. It shows
more tolerance to changes in weld current, voltage,
or power and has nearly the same bond strength as
the 14
lb electrode force curve.
A comparison of weld schedules for several different
applications might show that they could be
consolidated into one or two weld schedules. This
would have obvious manufacturing advantages.
Typical Weld Strength Profile