CHAPTER 1: DESCRIPTION
UB25 LINEAR DC RESISTANCE WELDING CONTROL
990-665 1-7
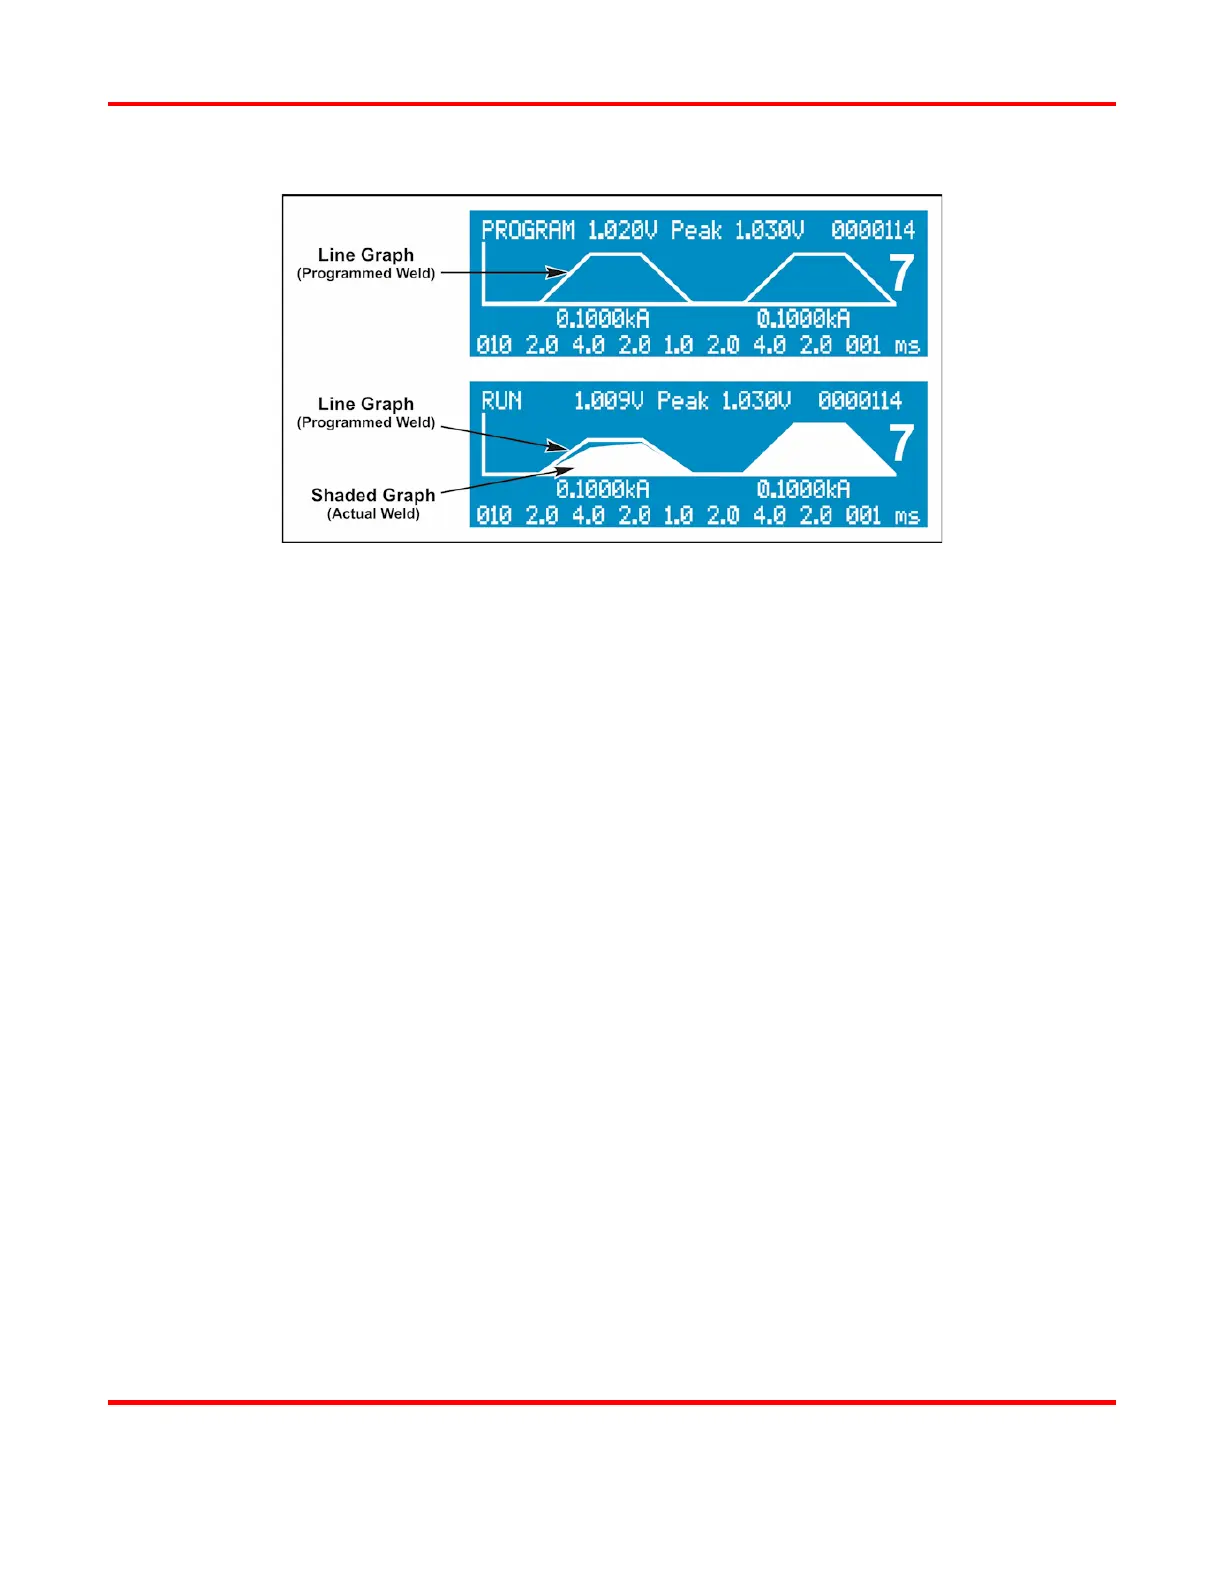
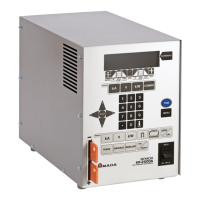
Graphed Data
Graphed Data
Line Graph. When you enter data to program a weld schedule, the Power Supply automatically draws
the data in graphic form, a line graph [or waveform] of a programmed weld schedule. As you enter
data on the keypad, you will see the graph change as you program new data. When you have entered
all the data, you will see the completed waveform.
Shaded Graph. After each weld is performed, the LCD displays a white, shaded graph showing the
waveform of the actual weld pulse. The LCD now displays both graphs together, allowing you to
visually compare the line graph to the shaded graph to see if the weld was completed properly.
The actual weld energy delivered [shaded graph] is dependent on the load resistance, including cables,
the weld head, and parts to be welded. A missing area of the shaded graph indicates that the Power
Supply is not able to deliver the programmed energy, most likely due to the load resistance. If the front
part of the shaded graph is missing, the load resistance is not allowing the Power Supply to instantly
deliver the programmed energy. You can compensate for this by using the upslope feature when
programming a weld schedule [see Chapter 3, Using UB25 Welding and Monitoring Functions and
Chapter 4, Operating Instructions]. The data lines on the LCD may also display alarm messages
showing that the weld was inhibited, stopped, or terminated and the reason why the action was taken.