Installation and Start-Up | 3-43
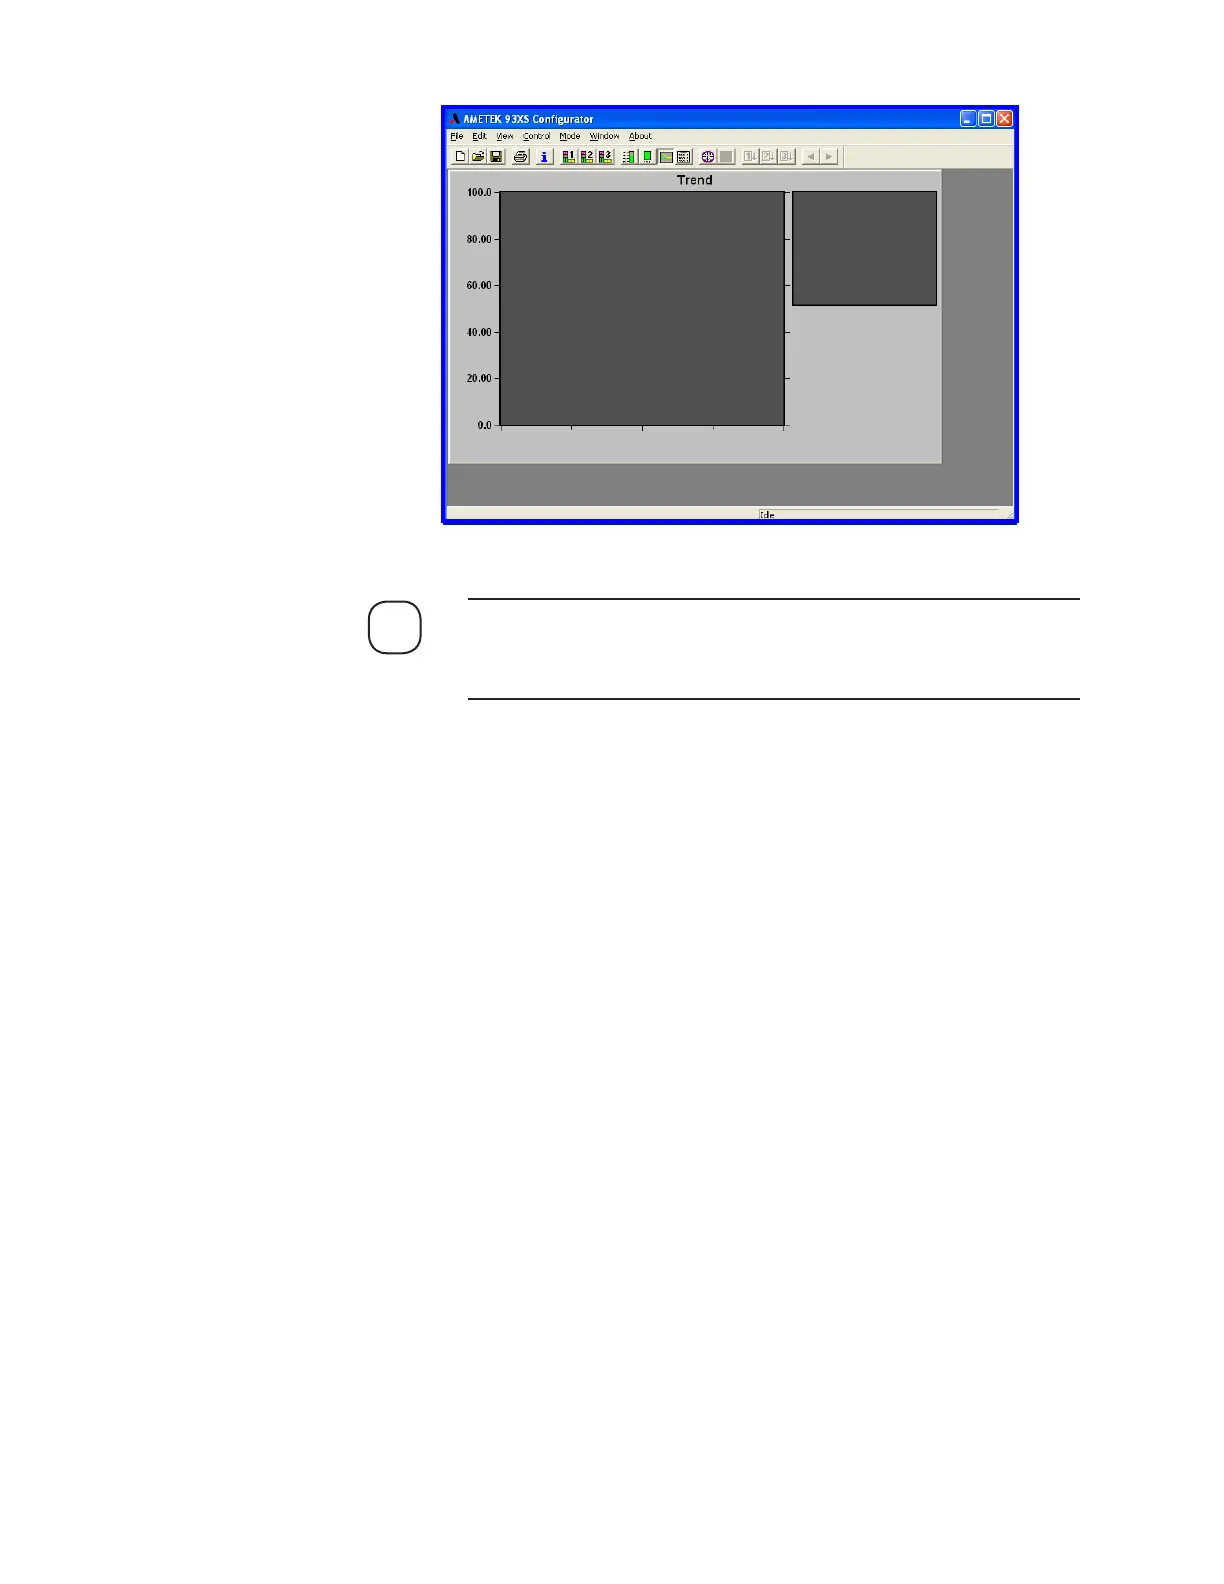
If the X-axis time interval on the ColumnSetup.dyc needs to be ad-
justed, right-click your mouse button on the graph, click Display and
change the time period in the Minutes text field.
4. The sample gas should now be flowing through the analyzer and peri-
odically, approximately every 120 seconds (default setting), should be
switching the two columns. The graph on the computer screen being
displayed should resemble one of the three graphs in Figure 3-24. Im-
mediately after a column switch, the real-time concentrations of H
2
S,
COS, and MeSH should drop.
After a short time delay (usually 10–20 seconds) the concentration of
H
2
S should start to increase. This is the onset of H
2
S elution from the
column. A few seconds later, COS should also begin to elute from the
column. The concentrations should then stabilize into a plateau.
Eventually, if the Switching Interval (Figure 3-23) is sufficiently long,
the MeSH will elute and also plateau. Typically, EtSH elution may
begin soon after (10–30 seconds) the MeSH stabilizes into a plateau.
Figure 3-22.
Column setup graph.
NOTE
 Loading...