14.2 Statistics
The "Statistics" menu provides an
overview of the consumption of beverages
over a given period.
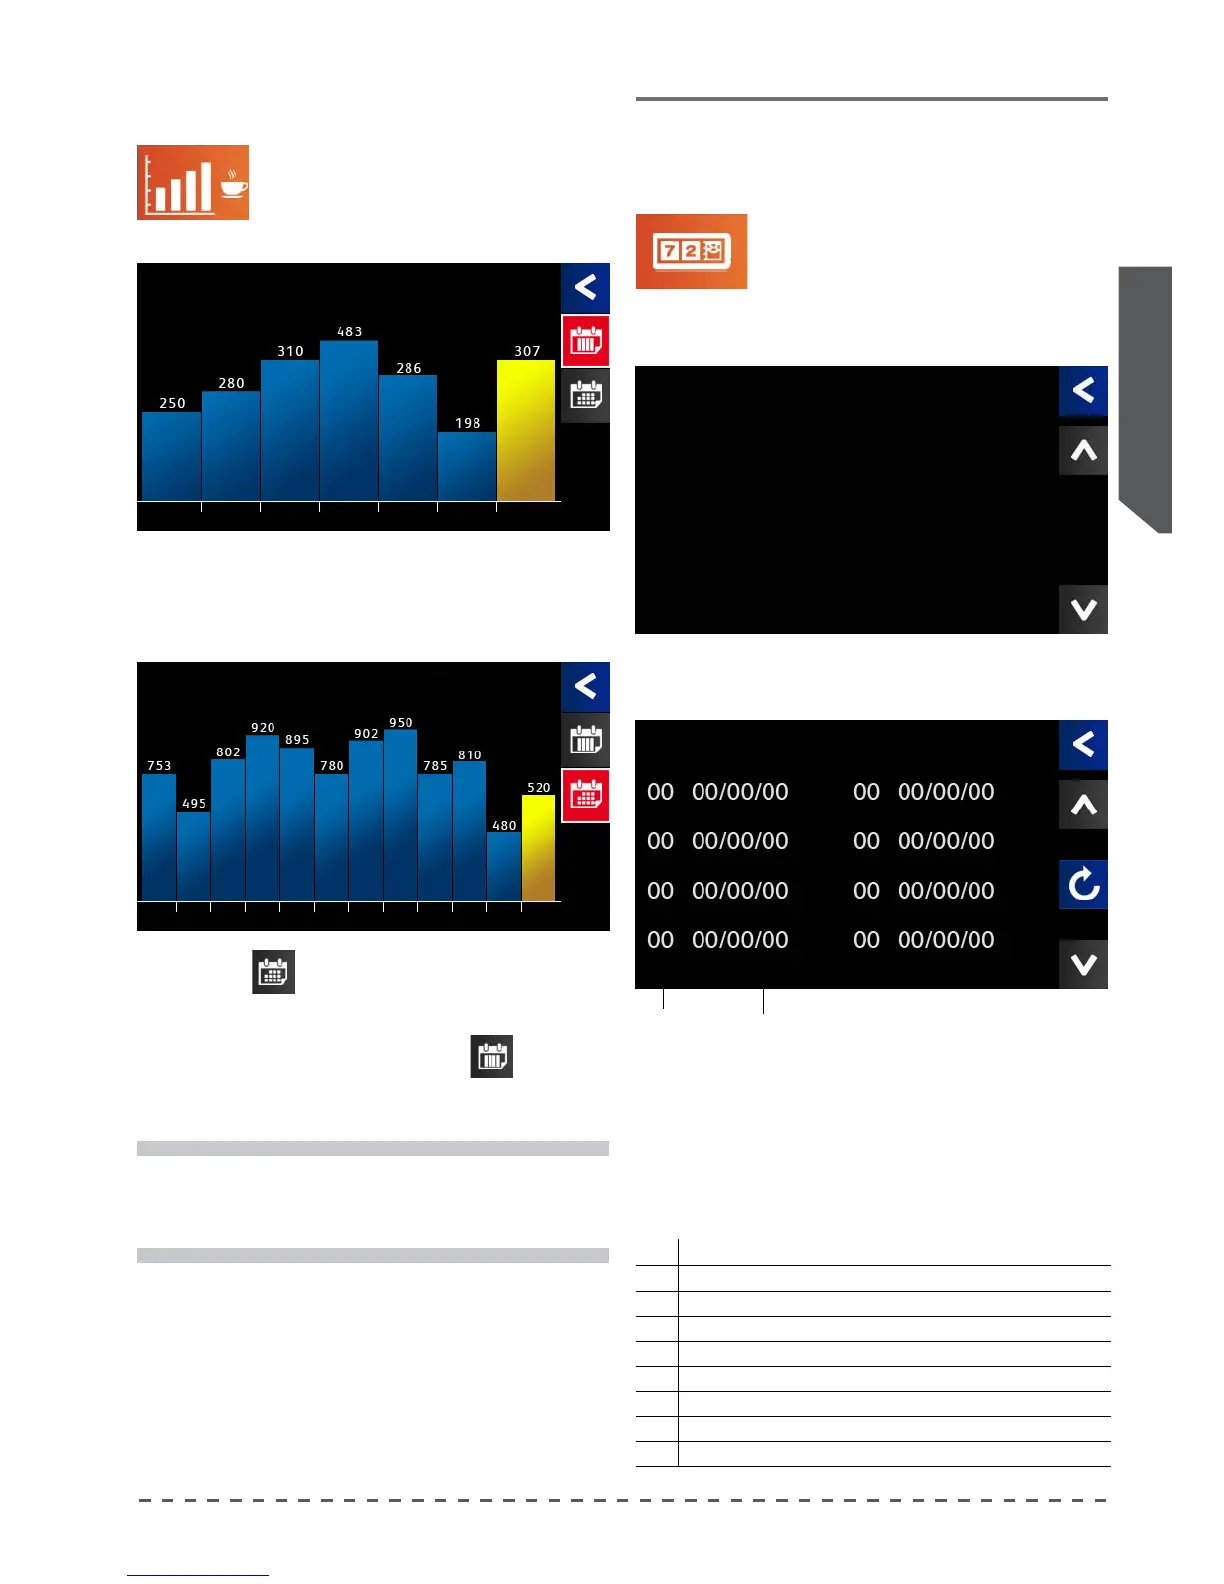
By accessing this menu, the screen shows the vertical
bar graph of the coee deliveries trend in the past week.
Pressing (
), changes the mode of display by
month, and shows the last year of coffee deliveries
divided by month.
To return to the weekly view, press (
).
Statistics
i
The yellow bar indicates the current day / month.
15 Scheduled maintenance
15.1 Alarm display
This function permits verication of
the last 8 alarms detected by the machine
• Press "Counters"; after a short time the
main screen appears.
• Scroll through the screens with the arrows () or (),
until you see the screen below:
Alarm
code
Last event
date
Counters
The last shows the last eight alarms stored by the
machine. The table below provides the correspondence
of the alarm code with its description.
Alarms code table:
Code
Alarm description
1 Heat sensor group open on group 1
2 Heat sensor group open on group 2
3 Heat sensor group open on group 3
4 Heat sensor group open on group 4
5 Check heating circuit group on group 1
6 Check heating circuit group on group 2
7 Check heating circuit group on group 3
8 Check heating circuit group on group 4
Statistics
Coee erogations
Last week
Thu Fri Sat Sun Mon Tue Wed
Statistics
Coee erogations
Last year
May
'15
Jun
'15
Jul
'15
Aug
'15
Sep
'15
Oct
'15
Nov
'15
Dec
'15
Jan
'15
Feb
'15
Mar
'15
Apr
'15
Counters
Total Coee 00000000
Total washes 000000
Alarm Register