indiGO Software Documentation LB 983 NightSHADE II Operating Manual
88
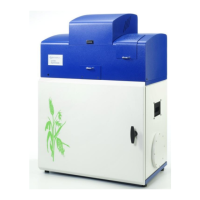
6.6 Data Slider
On the right margin of the screen you see the intensity scale of the measurement,
together with the associated slider. With these two sliders you can set the scaling of
the pseudocolor signal image and the lower threshold of the color view. The top
slider defines the intensity value.
The top slider defines which intensity value has been assigned to the highest val-
ued color. Values above this threshold are displayed in white.
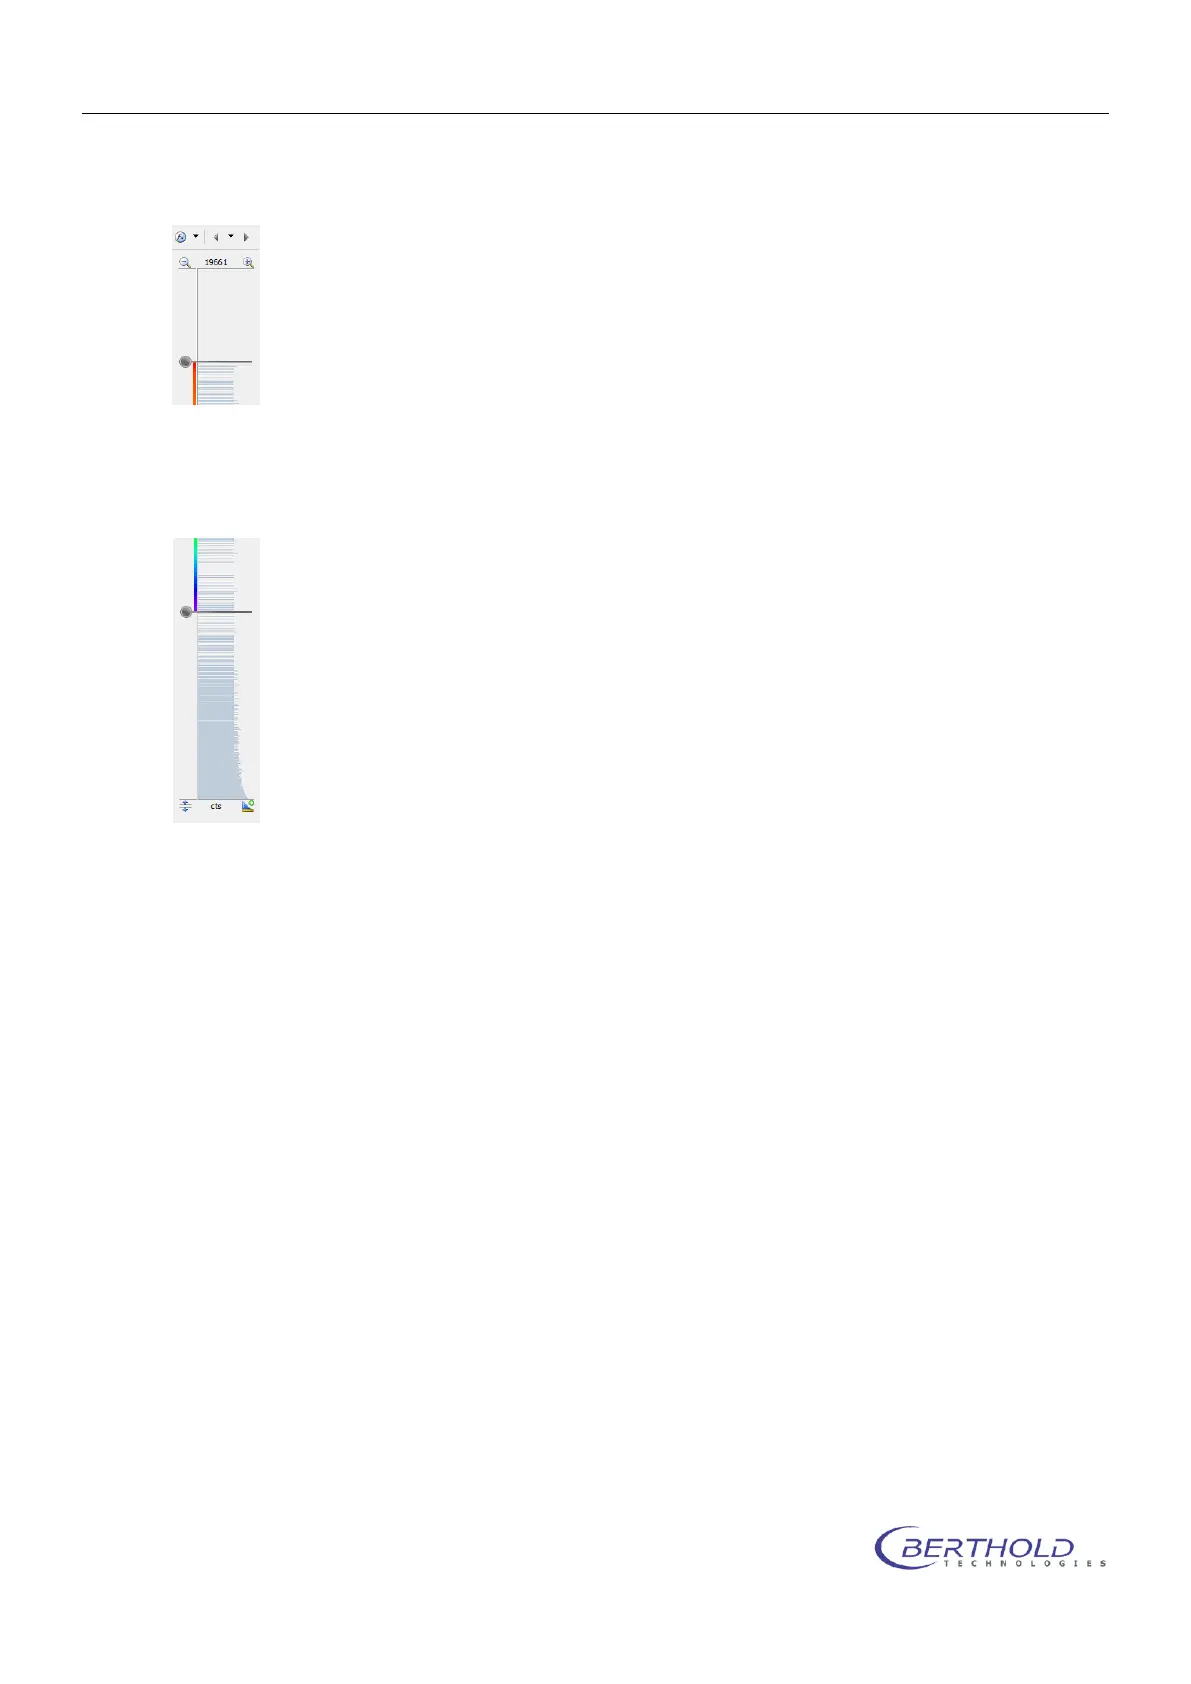
The bottom slider defines which intensity in the signal image is displayed with the lowest valued
color. All values below this threshold are not displayed.
6.6.1 Data Properties Quick Menu
The <Data Properties Quick Menu> supports the the same functions as the <Photo Properties
Quick Menu>.
6.6.2 Data Properties Dialog
Data
The Data page is used to select the measurements displayed. Each data image recorded can
be tagged to be relevant and displayed along with the photo.