Quick Start LB 983 NightSHADE II Operating Manual
58
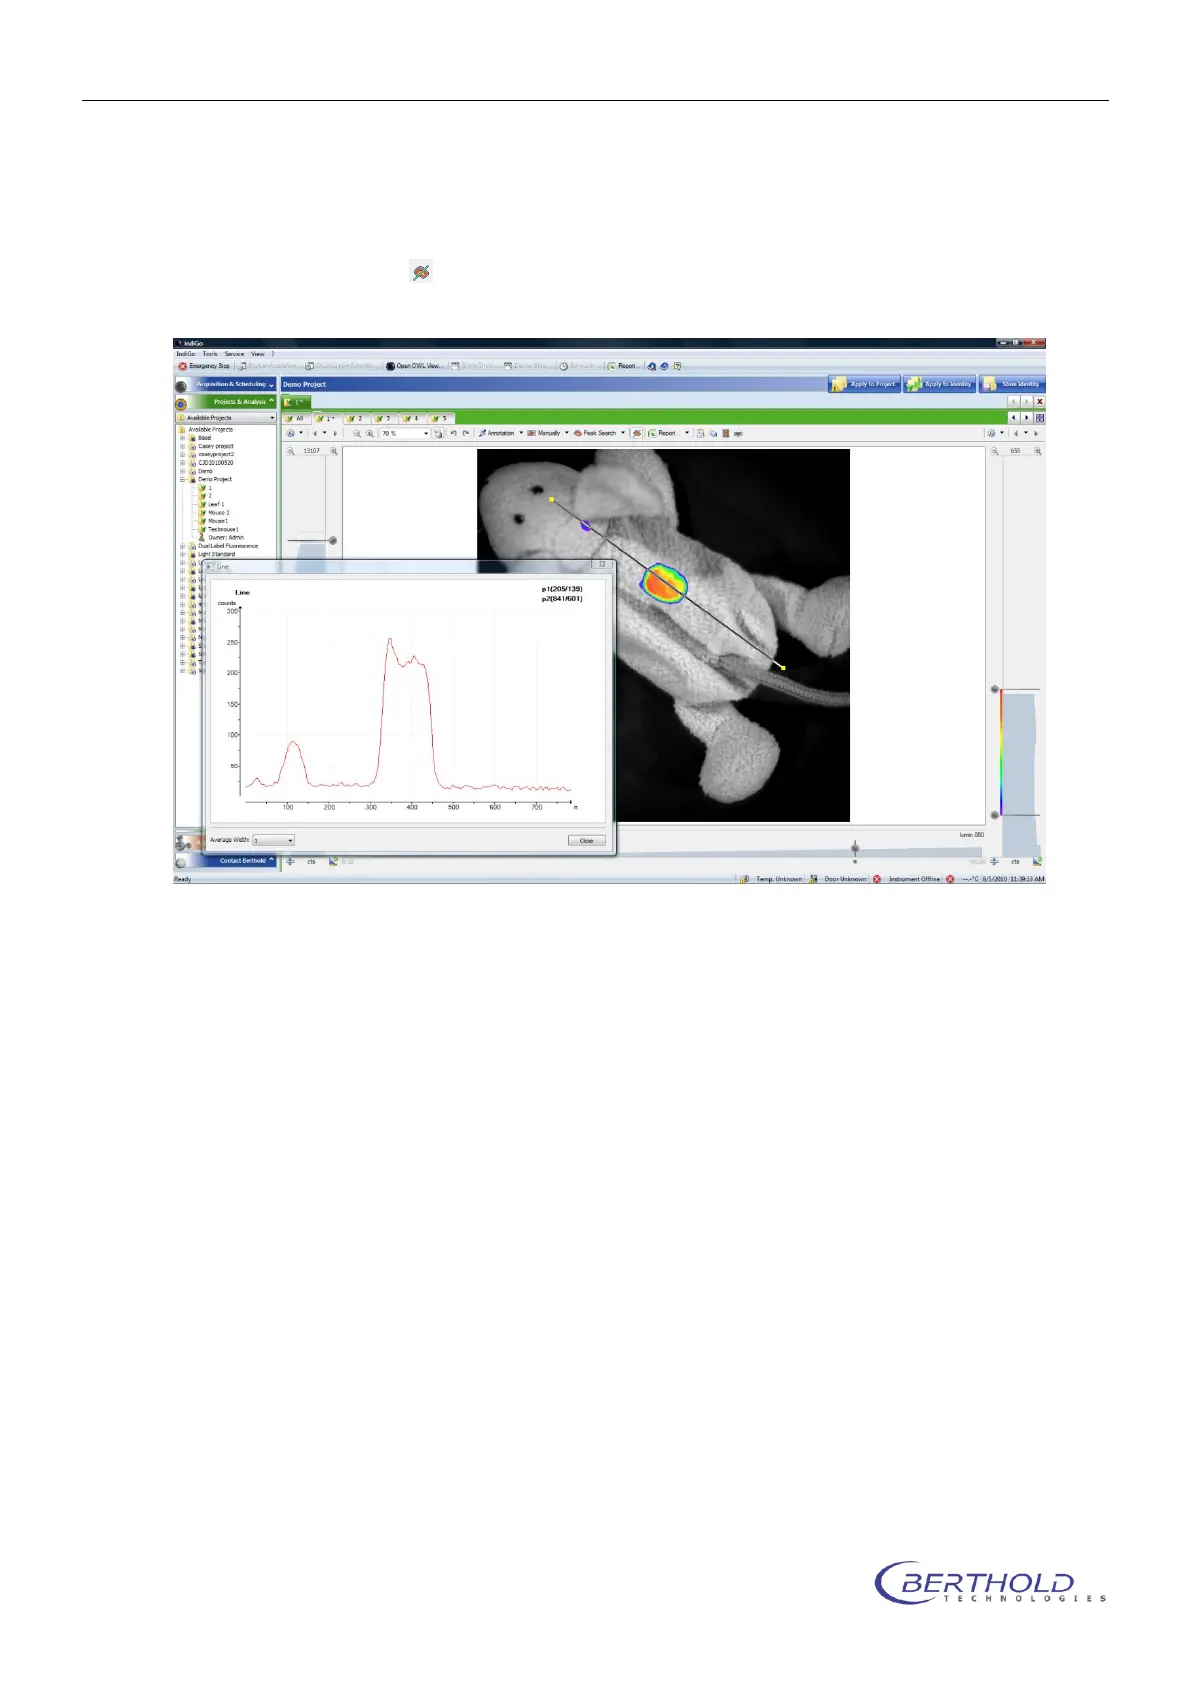
4.3.3 Line Plot
For further analysis of the measurements it might be helpful to create a 1D-line plot of the
measured data. This function is recommendet to evaluate the measuring data.
To use this function select .
An additional window is opened where the line profile created from a given lead is displayed.
The pixel intensity along the selected path is displayed as a line diagram. The average width of
the lead can be selected. Moving the lead updates the line profile.